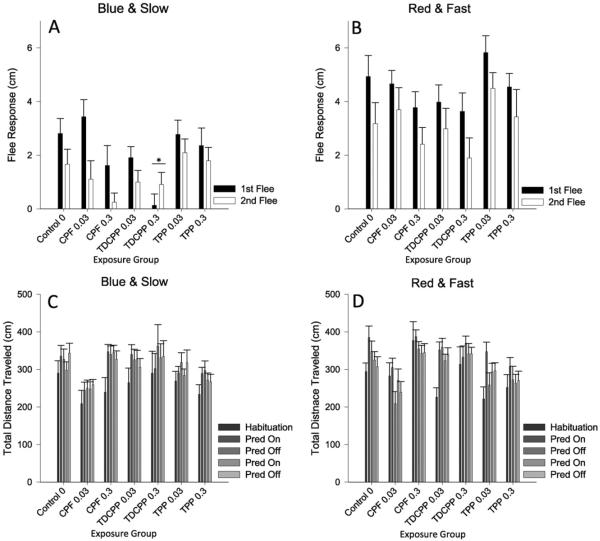
Fig. 5.
Predator Escape/Avoidance Assay. Panels A–B plot the first and second flee response in the trial for each exposure group. Panels C–D plot the total distance traveled for each exposure group for each minute (or condition) of the trial. Data during the blue/slow stimulus presentation are plotted in panels A and C and data during the red/fast stimulus presentation are plotted in panels B and D. Error bars represent SEM. An “*” denotes significant difference from control (p < 0.05).

