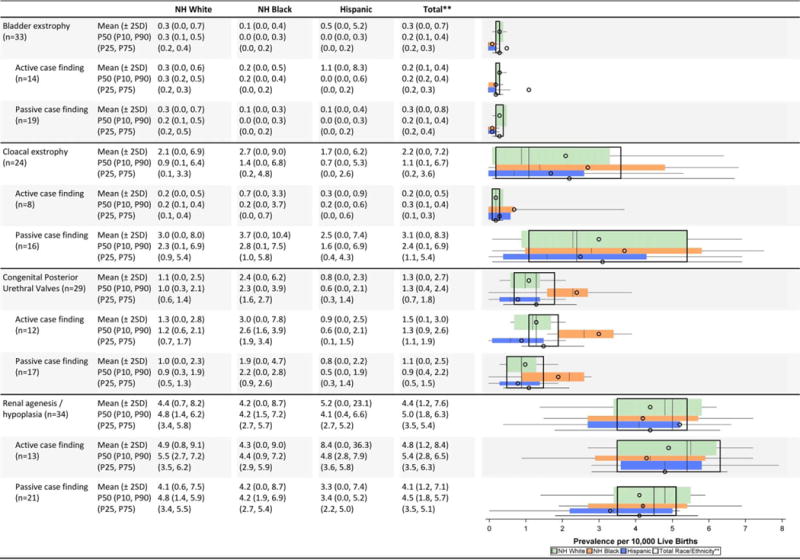
TABLE 2F.
Genitourinary Defects Prevalence Estimates (Prevalence per 10,000 Live Births): Measures of Central Tendency and Dispersion by Case-finding Methodology and Maternal Race/Ethnicity 2008–2012.

|

|
Hypospadias prevalence per 10,000 male live births.
Total also includes Asian and Pacific Islander, American Indian/Alaska Native and other/unknown race/ethnicity.
NH=Non-Hispanic; n=number of state programs; Chebyshev interval=Mean ± 2 Standard Deviations (SO); P10=10th percentile; P25=25th percentile; P75=75th percentile; P9D=90th percentile
