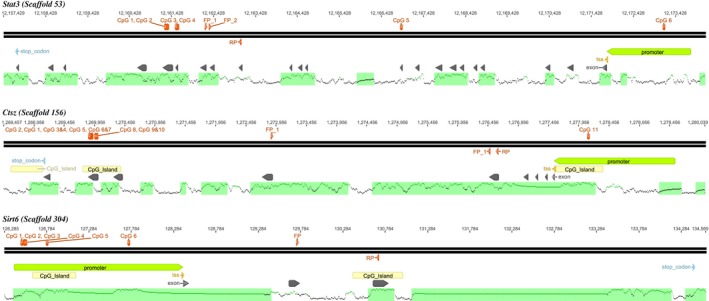
Figure 1.

Gene maps. For Stat3, Sirt6 and Ctsz CpG sites which were significantly changed in their methylation are displayed (red dots) at their specific genomic positions (numbers in the upper line) and in context of annotated region: promoter region (green arrow), exons (gray arrows), transcription start side (TSS, yellow arrow), stop codon (blue arrow), CpG islands (yellow arrows, Takai and Jones 2002) and the lower section contained CGIs (black lines) which were calculated by the percentage of CG dinucleotides, depicted as frequency graph. QPCRs are marked: forward primer (FP) and reverse primer (RP). For Stat3 and Sirt6, cDNA binding was ensured using an exon‐spanning forward primer indicated by FP_1 and FP_2 (Figures were generated using Geneious® v. 8.0.4.).
