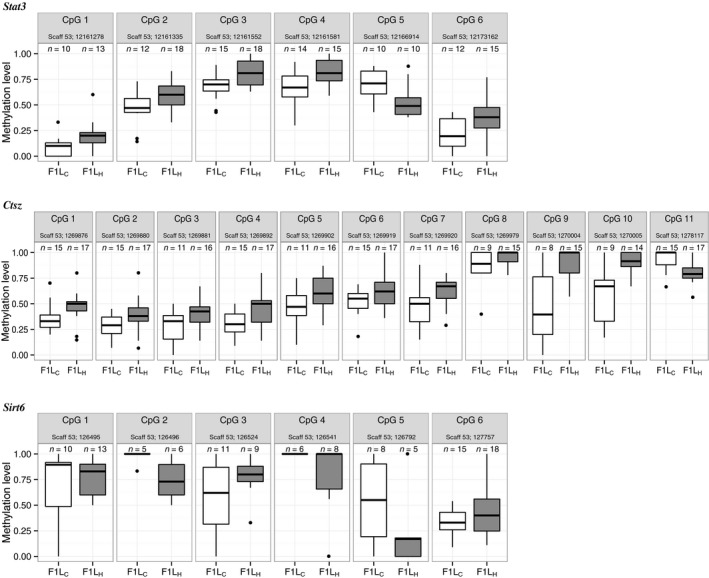
Figure 2.

CpG‐specific methylation levels. Boxplots show significant DNA methylation changes of the single CpG sites between F1C (white boxes) and F1H (gray boxes). Scaffolds (scaff) are indicated for the respective gene and genomic CpG positions for each CpG site. Only positions with a coverage ≥ 5 in the respective individual at the certain CpG position are incorporated (n = x). Stat3 is generally higher methylated in liver samples of F1H compared with F1C in all CpGs but CpG 5. Those results are similar to those of Ctsz which shows lower methylation in F1H only in CpG 11. In contrast, methylation levels of Sirt6 varied more frequently in F1H compared with F1C. Here, hypomethylation was detected at CpG 1, 2, 4, and 5 and hypermethylation at CpG 3 and CpG 6.
