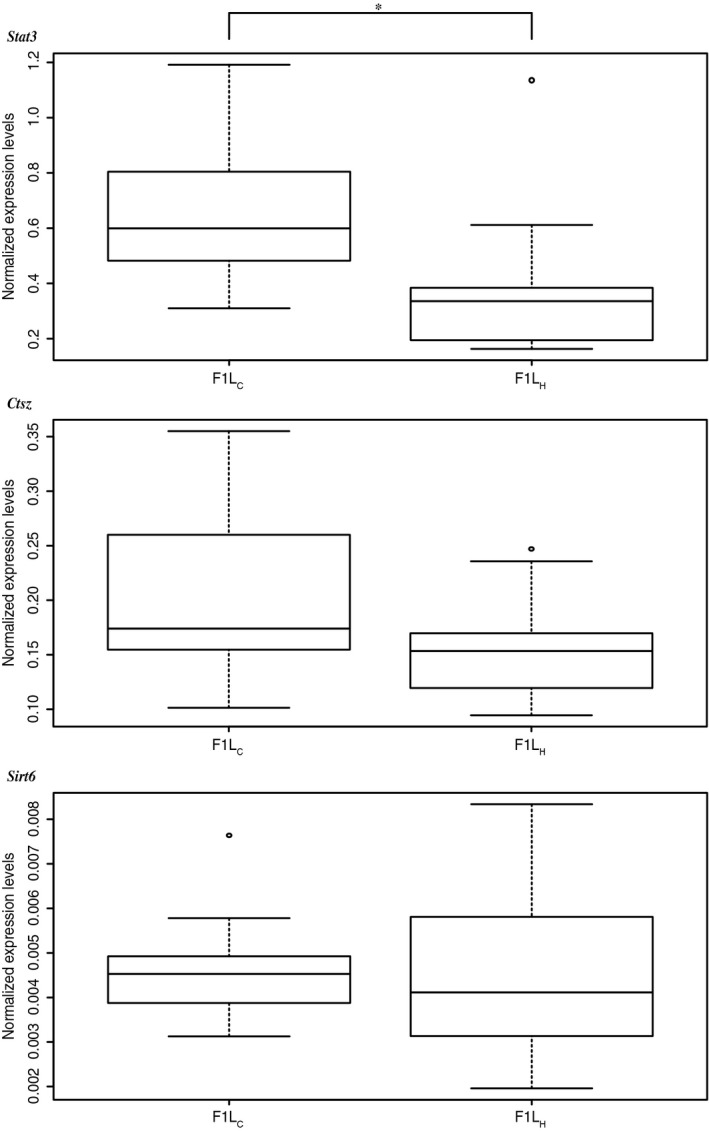
Figure 3.

Expression levels. Boxplot of Stat3, Sirt6, and Ctsz normalized expression levels of control F1C and heat F1H group. Stat3 showed a significant twofold change between groups (*P = 0.00069). In comparison with Stat3 and Ctsz, the mRNA expression values of Sirt6 were rather low.
