
Figure 5. Outflow tract length and conotruncal septation are affected by ARID1A loss in cardiac NCCs.
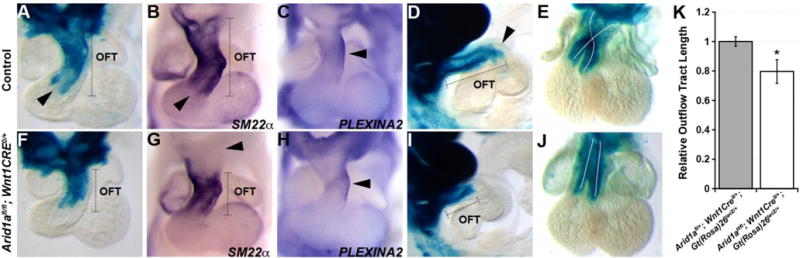
(A,B,C and F,G,H) Frontal-view images of lacZ-, SM22α, or PLEXINA2-stained E10.5 Arid1afl/fl; Gt(ROSA)26tm1Sor; Wnt1Cre and control hearts. Arrowheads in A and B denote the early aorticopulmonary septum. Arrowheads in C and H denote PLEXINA2 expression domain in OFT. Arrowhead in G denotes the aortic sac. (D,I) Sagittal-view images of lacZ-stained E10.5 Arid1afl/fl; Gt(ROSA)26tm1Sor; Wnt1Cre and control outflow tracts. Arrowhead in D denotes the early separation of future pulmonary artery and aorta. (E,J) Frontal-view images of lacZ-stained E11.5 Arid1afl/fl; Gt(ROSA)26tm1Sor; Wnt1Cre and control hearts. (K) Graph of relative outflow tract length measurements for lacZ-stained 10.5 Arid1afl/+; Gt(Rosa)26lacZ/+; Wnt1Cre and Arid1afl/fl; Gt(Rosa)26lacZ/+; Wnt1Cre embryos. Significant differences based on the average measurement ±standard deviation were calculated using a two-tailed Student’s t test (*p-value < 0.05). OFT, outflow tract.