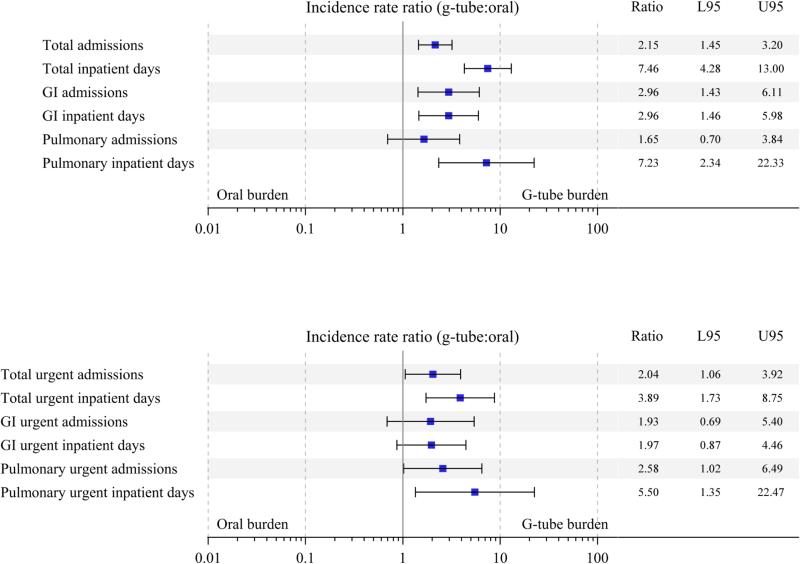
Figure 2.
Forest plots showing results of negative binomial regression, adjusted for neurologic, cardiac, and pulmonary comorbidities, as well as sex, age, and weight-for-age z-score. A, Total admissions and inpatient days among those admitted, as well as type of admissions. B, Total urgent admissions and inpatient days among those with urgent admissions, as well as types of urgent admissions. Results are expressed on a multiplicative scale, as the ratio of the incidence rate in the g-tube group to the incidence rate in the oral group. Analysis of inpatient days were restricted to admitted patients only.

