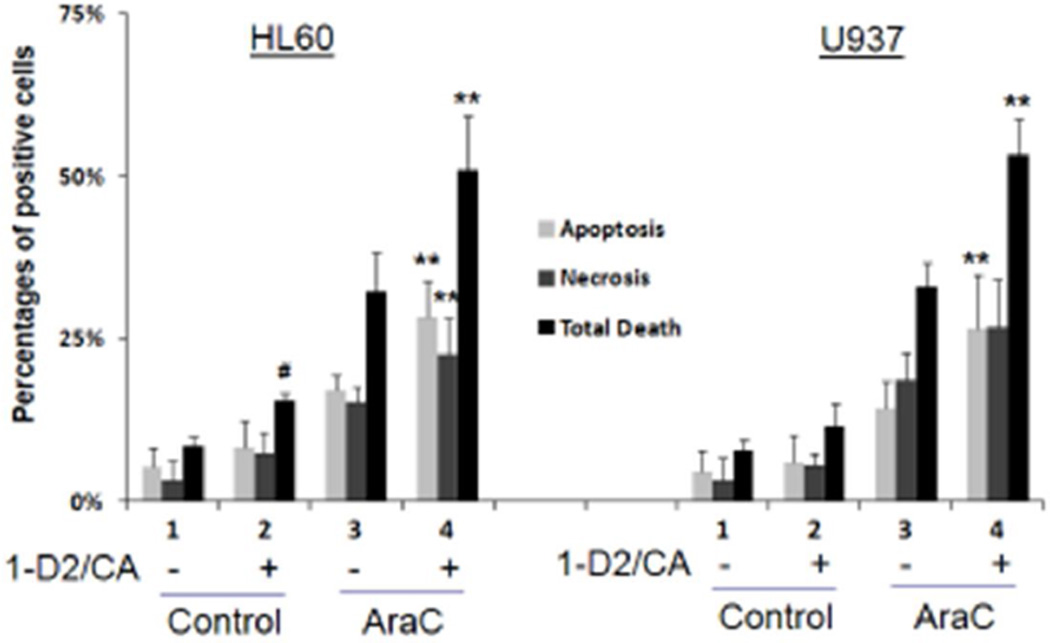
Figure 1. Comparison of the effects of 1-D2/CA on AraC-induced cell death in cell lines.
The treatment groups were: 1. Vehicle control- for 96 h; 2. 1-D2 96 h; 3. AraC-72 h- medium only −96 h; 4. AraC-72 h-1-D296 h. The concentrations and other experimental details are described in Materials and Methods. # = p<0.05 when compared to control, *= p < 0.05, and ** = p < 0.01, compared with AraC treated group; n=3 for both HL60 and U937 cells.

