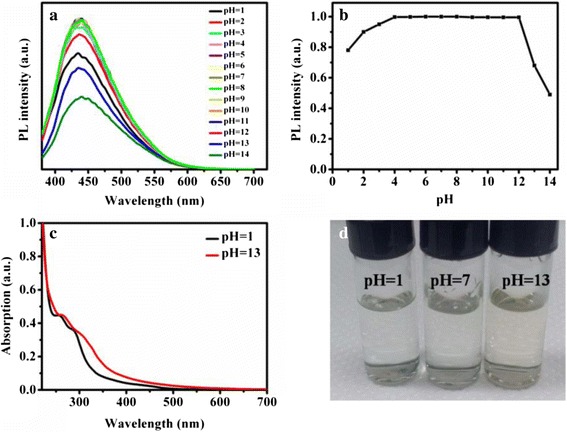
Fig. 4.

The effect of pH for the CDs. a PL spectra for various pH in the range 1–14. b The PL intensity of pH variation. c The absorption spectra of CDs in aqueous solution under pH = 1 and 13. d The photographs of CDs under room light at pH = 1, 7, and 13
