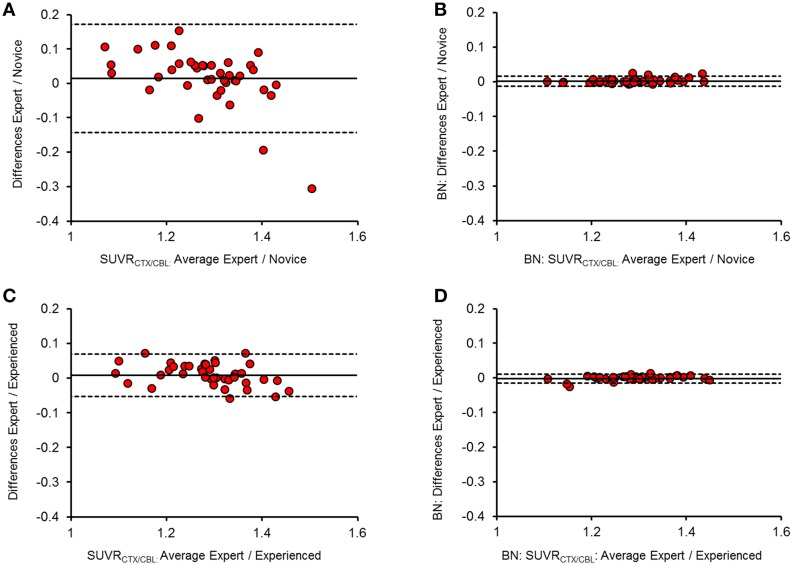
Figure 2.
Bland-Altman plots of the inter-reader SUVRCTX∕CBL(n = 40) agreement before (A,C) and after (B,D) brain spatial normalization. Difference (y-axis) and mean (x-axis) between two readers are illustrated against each other, with the mean difference presented by the thick line and the upper (+1.96 SDs) and lower limits (−1.96 SDs) of agreement by the dashed lines. Panels (A,B) show the comparison between expert and novice reader, while (C,D) show the relation between expert and experienced reader.

