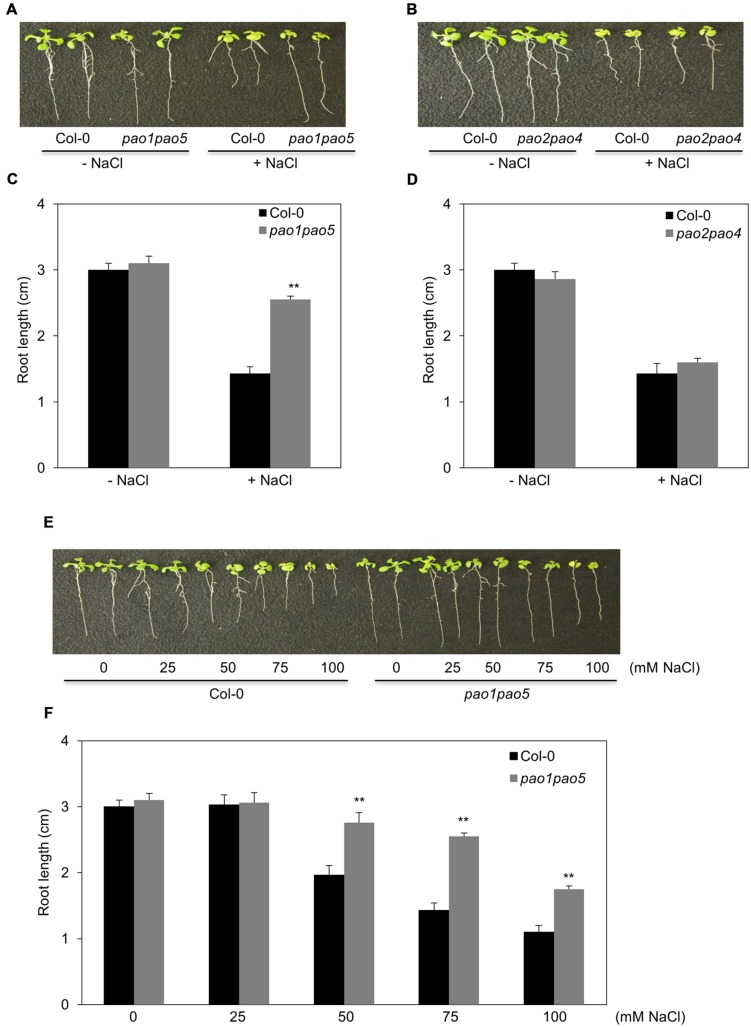
FIGURE 1.
Growth responses of pao1 pao5 and pao2 pao4 to various concentrations of NaCl. (A) Growth response of pao1 pao5 to 100 mM NaCl. (B) Root lengths of WT and pao1 pao5 with or without 100 mM NaCl after a 14 days incubation. The values indicate means ± SE (n = 5). (C) Growth response of pao2 pao4 to 100 mM NaCl. (D) Average root length of WT and pao2 pao4 with or without 100 mM NaCl after a 14 days incubation. The values indicate means ± SE (n = 5). (E) Growth responses of WT and pao1pao5 plants to different NaCl levels in MS agar medium. Two representative plants, each incubated for 14 days, were photographed. (F) Root length of WT and pao1 pao5 grown on MS agar medium containing 0, 25, 50, 75, and 100 mM NaCl for 14 days. The values indicate means ± SE (n = 5). Asterisk indicates significant difference between WT (Col-0) and pao1 pao5; ∗∗P < 0.01.

