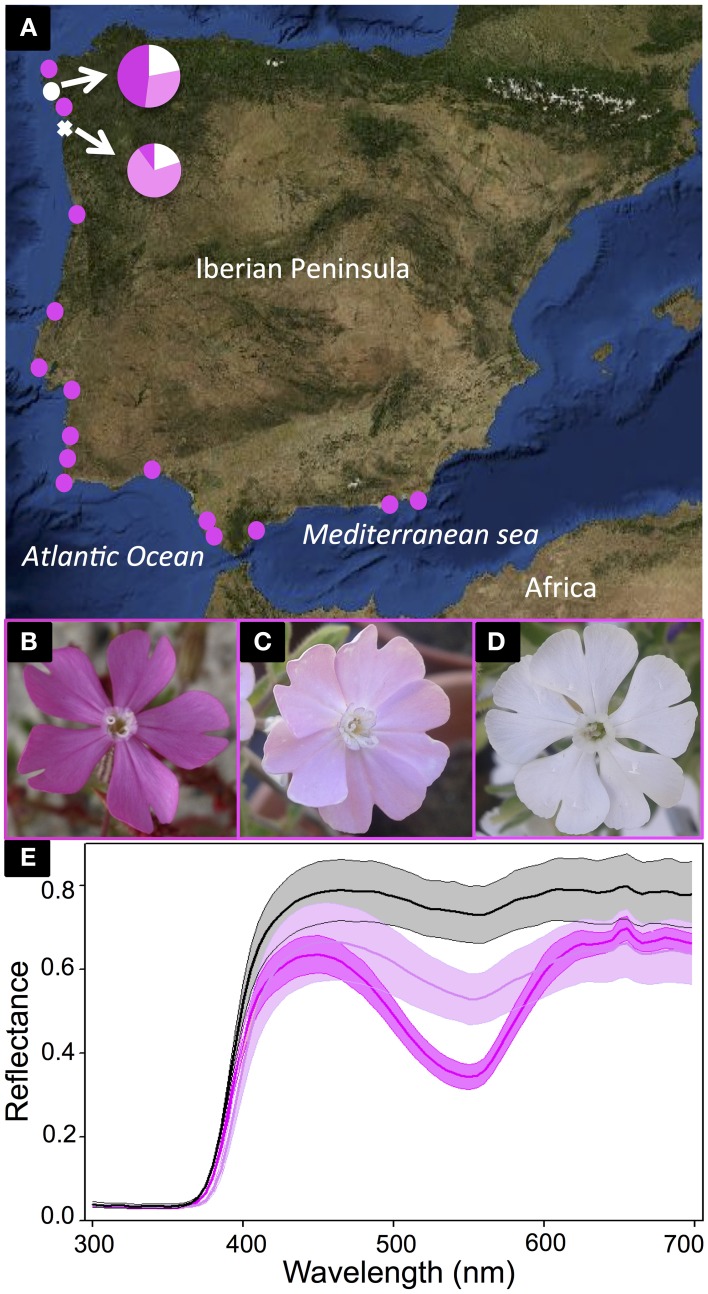
Figure 1.
Silene littorea sampling and flower color polymorphism. The map in (A) shows S. littorea populations along the Iberian Peninsula where flower color frequencies were estimated. The two polymorphic populations are indicated with white symbols and the proportions of white-, light pink-, and dark pink-flowered individuals in each population are illustrated with pie diagrams. Pink circles indicate populations fixed for dark pink petal color. The polymorphic population (Playa de Barra) sampled for RNA-Seq and biochemical analysis is indicated with a white cross. The three distinct color morphs are illustrated in (B–D): dark pink (B), light pink (C), and white (D). The average UV-VIS spectral reflectance of the upper surface of the petals of six dark pink samples (dark pink line), six light pink samples (light pink line), and three white samples (black line) are indicated in (E) with standard errors (shadow area).

