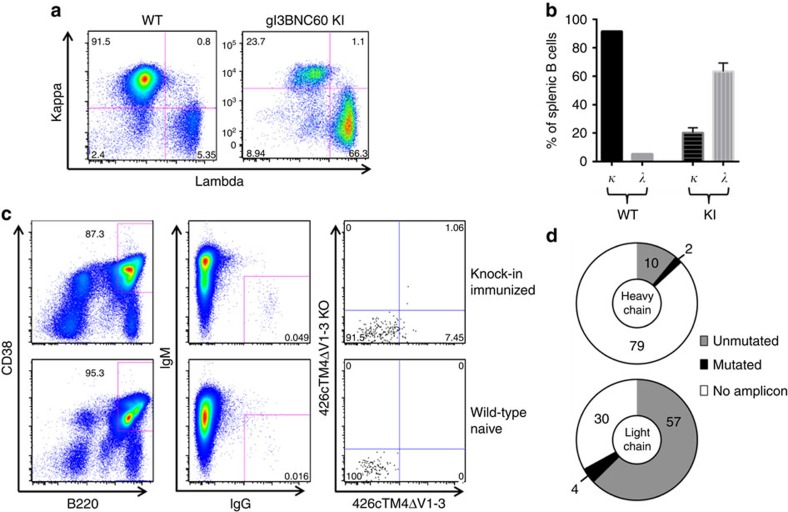
Figure 4. Sequencing of antibody and light chain transcripts from gl3BNC60 KI mice.
(a) CD4−CD8−, Ly-6G− and Ly-6C− B220+ CD19+ splenocytes from WT (left panel) and gl3BNC60 KI (right panel) mice were stained with anti-mouse kappa, or lambda antibodies. (b) Summary of kappa and lambda frequencies in WT (n=1) and gl3BNC60 KI mice (n=6) as determined by counting the single kappa-positive or single lambda-positive populations in a. Error bars represent s.d. (c) Representative FACS plots of splenocytes from an immunized gl3BNC60 KI mouse (top panels) and a naive wild-type mouse (bottom panels). In brief, CD4−, CD8−, Gr1− splenocytes were stained with the B-cell markers B220 and CD38 (left panel), B220+,CD38+ cells were stained for IgG and IgM (middle panel). Class switched IgM− IgG+ cells were stained with 426c.TM4ΔV1-V3 and 426c.TM4ΔV1-V3-KO (right panel). 426c.TM4ΔV1-V3+, 426c.TM4ΔV1-V3-KO− (lower right hand quadrant, of upper right panel) single cells from immunized mice were sorted into individual wells on a 96-well plate. (d) Summary of gl3BNC60 heavy- and light-chain sequences recovered from expressed transcripts. Numbers indicate the number of wells belonging to each category.

