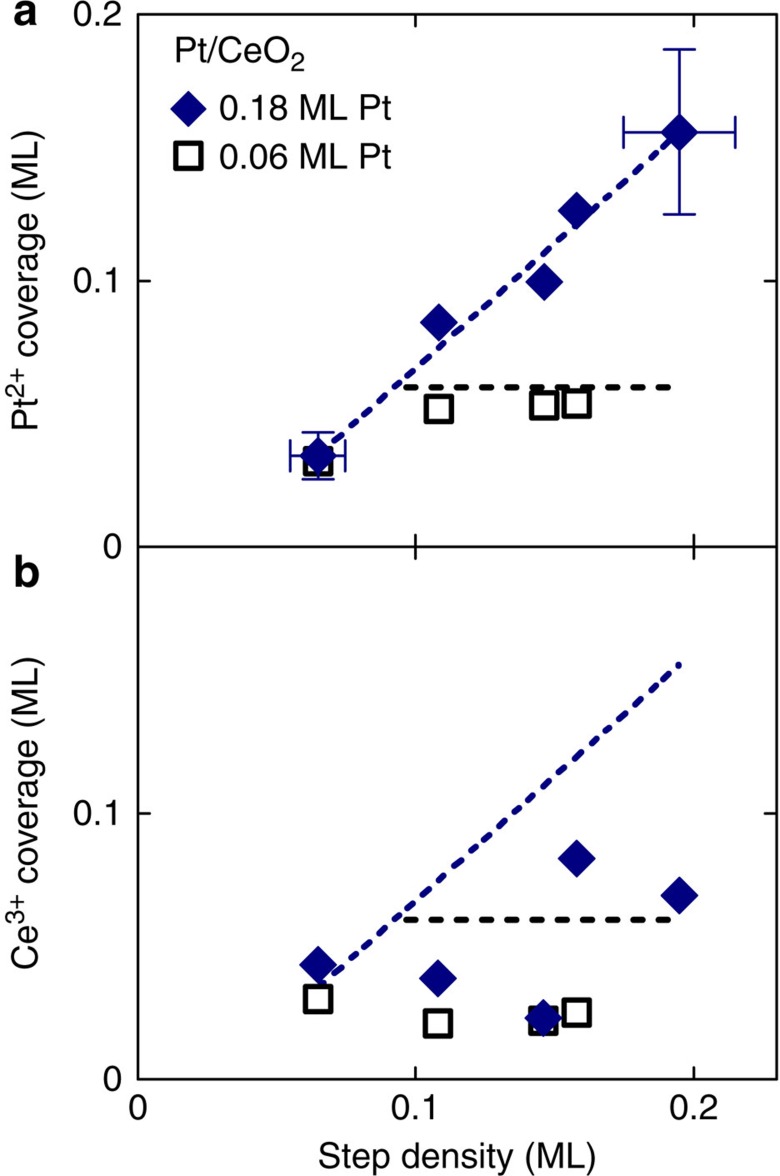
Figure 2. Capacity of stepped CeO2(111) surface to accommodate Pt2+.
(a) Amount of Pt2+ stabilized on CeO2(111) substrates with different density of steps for 0.18 ML (blue symbols) and 0.06 ML (black symbols) of deposited platinum. Pt not stabilized in the form of Pt2+ remains metallic. Lines represent guides to the eyes. Blue line is a linear fit of 0.18 ML Pt data. Black line represents the maximum achievable amount of Pt2+ in the case of 100% oxidation of Pt for 0.06 ML of deposited Pt. (b) Reduction of the ceria surface accompanying the stabilization of Pt2+ ions determined by resonant PES expressed as a coverage of the surface by Ce3+ ions. Lines represent guides to the eyes from a and indicate the Pt2+ concentration. The Ce3+ concentration is lower or equal to the Pt2+ concentration on all samples.

