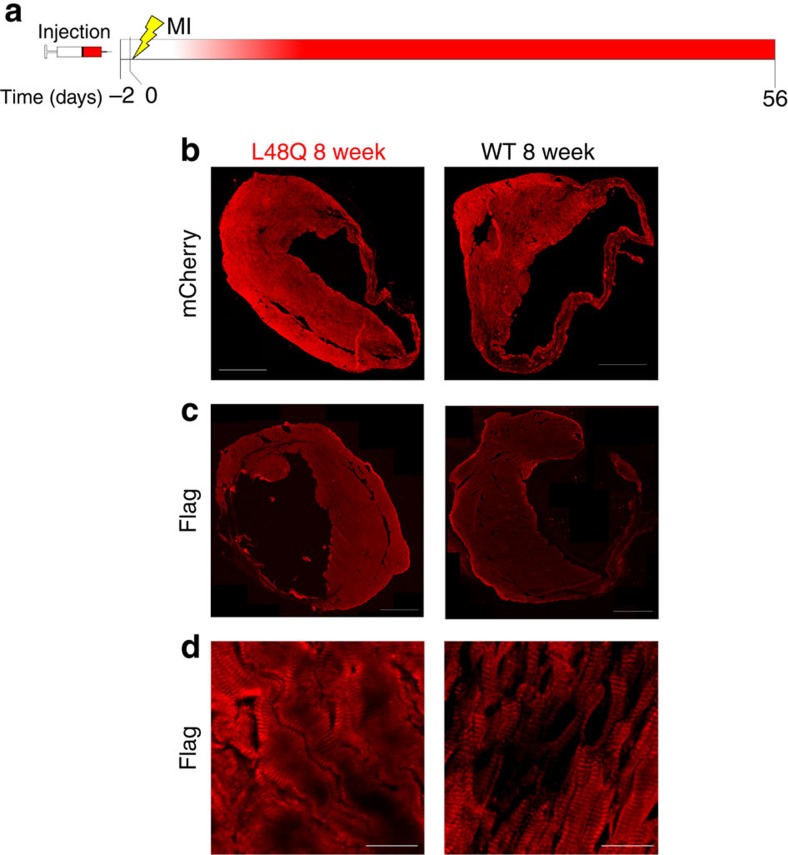
Figure 7. Histological analysis of therapeutic MI hearts.
(a) Timeline of rAAV9 injection, induction of myocardial infarction and terminal measurements. The gradient of red in the timeline shows the approximate timing of TnC expression. Representative images for TnC L48Q and TnC WT-8-weeks post MI showing: (b) mCherry fluorescence (scale bar, 1,000 μm), (c) anti-Flag immunofluorescence (scale bar, 1,000 μm); and (d) sarcomeric anti-Flag immunofluorescence (scale bar, 25 μm).

