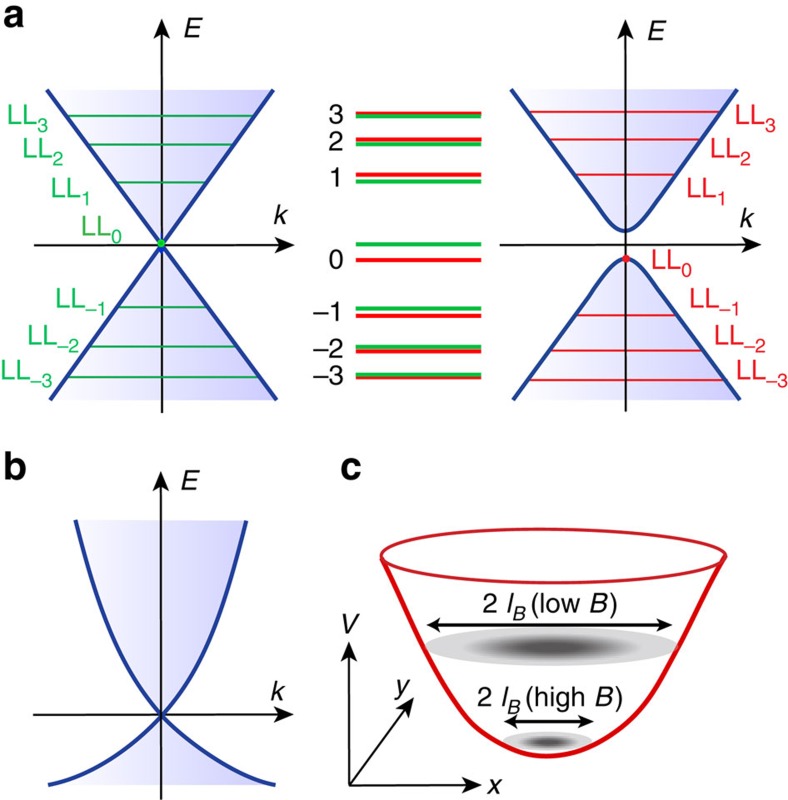
Figure 1. Zeeman effect of TSS and extrinsic influences on its observation.
(a) Schematic illustrating the Zeeman effect on the LLs of the TSS. When the Zeeman effect is absent, LLs (green lines) are formed in a perpendicular B. When the Zeeman effect is present, the TSS becomes massive and its LLs (red lines) exhibit an additional energy shift away from the Dirac point. The magnitude of the Zeeman shift decreases rapidly with increasing Landau index n. (b) Schematic showing the band structure of the actual TSS with a finite curvature superimposed on its linear dispersion. (c) Schematic of a 2D potential minimum and the spatial extension of the LL0 wave function at different B. The dark (light) grey colour depicts high (low) intensity of the LL0 wave function.

