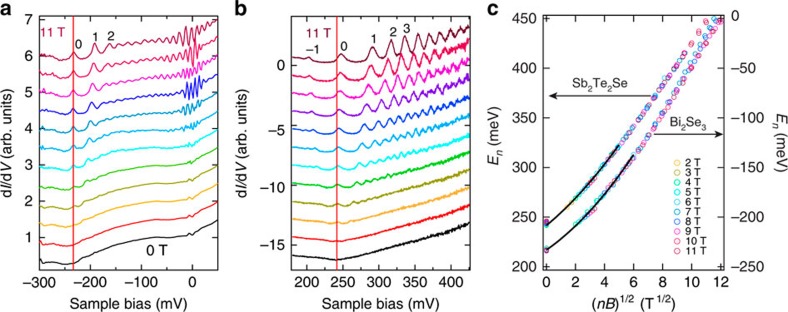
Figure 2. LL spectroscopy of Bi2Se3 and Sb2Te2Se.
Tunnelling spectroscopy showing the LLs of the TSS measured at a fixed location of (a) Bi2Se3 and (b) Sb2Te2Se surface at 1.5 K. The spectra were acquired at different B from 0 T to 11 T with an interval of 1 T and are offset vertically for clarity. The red lines mark the energies of the Dirac points. The data shown in a are the same data used in ref. 22. Measurement conditions of b: Vs=−100 mV, It=50 pA and Vmod=1.4 mVrms. (c) Scaling analysis of En(B) based on the data of Sb2Te2Se shown in b and a comparison with that of Bi2Se3. The En values were obtained by fitting the LL spectra with multiple Lorentz functions. The black curves depict the fitting to the low-energy parts of the scaling relations.

