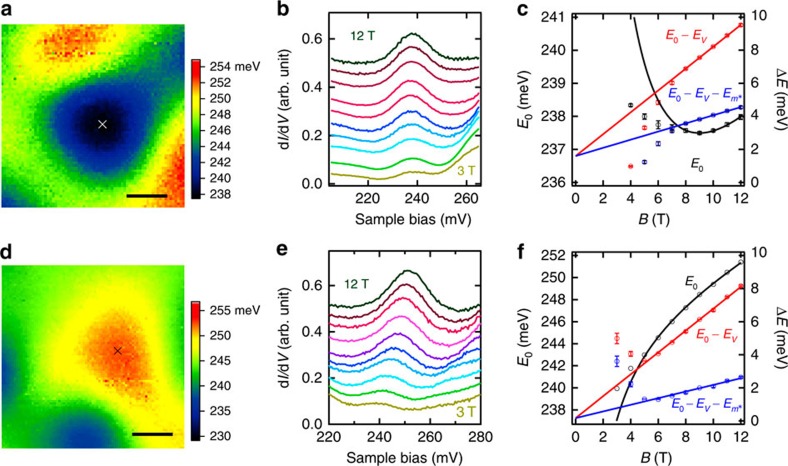
Figure 4. Surface g-factor measurement on Sb2Te2Se.
(a) Potential landscape of Sb2Te2Se obtained by mapping E0 at 12 T showing a potential minimum. The centre of the potential minimum is determined by the 2D parabolic potential fitting and marked by a cross. The scale bar corresponds to 10 nm. (b) Tunnelling spectra taken at the potential minimum centre at fields from 3 to 12 T with 1 T intervals. The spectra have been shifted for clarity. (c) E0 values at different B obtained by fitting the data of b with a Lorentz line shape and plotted with black symbols (left axis). The error bars are the standard deviation of the fitting analysis. The effects of the potential and the non-ideal dispersions on the LL0 energies are represented by  and
and  , respectively. Their influences can be excluded by subtracting their contributions. The red symbols denote the LL0 energies after subtracting the effect of the potential (E0−EV). The blue symbols correspond to the LL0 energies after subtracting the effects from both the potential and the non-ideal dispersions (
 ) (right axis, in the relative energy scale). The black curve denotes the fitting to E0 with B according to equation (2). The red and blue lines represent the linear fitting of E0−EV and
  with B, respectively. (d–f) Similar data and analysis as a–c for a potential maximum of Sb2Te2Se. Measurement conditions of a and d: Vs=215 mV, It=50 pA, Vmod=2.8 mVrms, T=4.4 K and B=12 T. Measurement conditions of b and e: Vs=210 mV, It=50 pA, Vmod=1.8 mVrms and T=4.4 K.

