. 2016 Feb 25;16(1):75–84. doi: 10.4110/in.2016.16.1.75

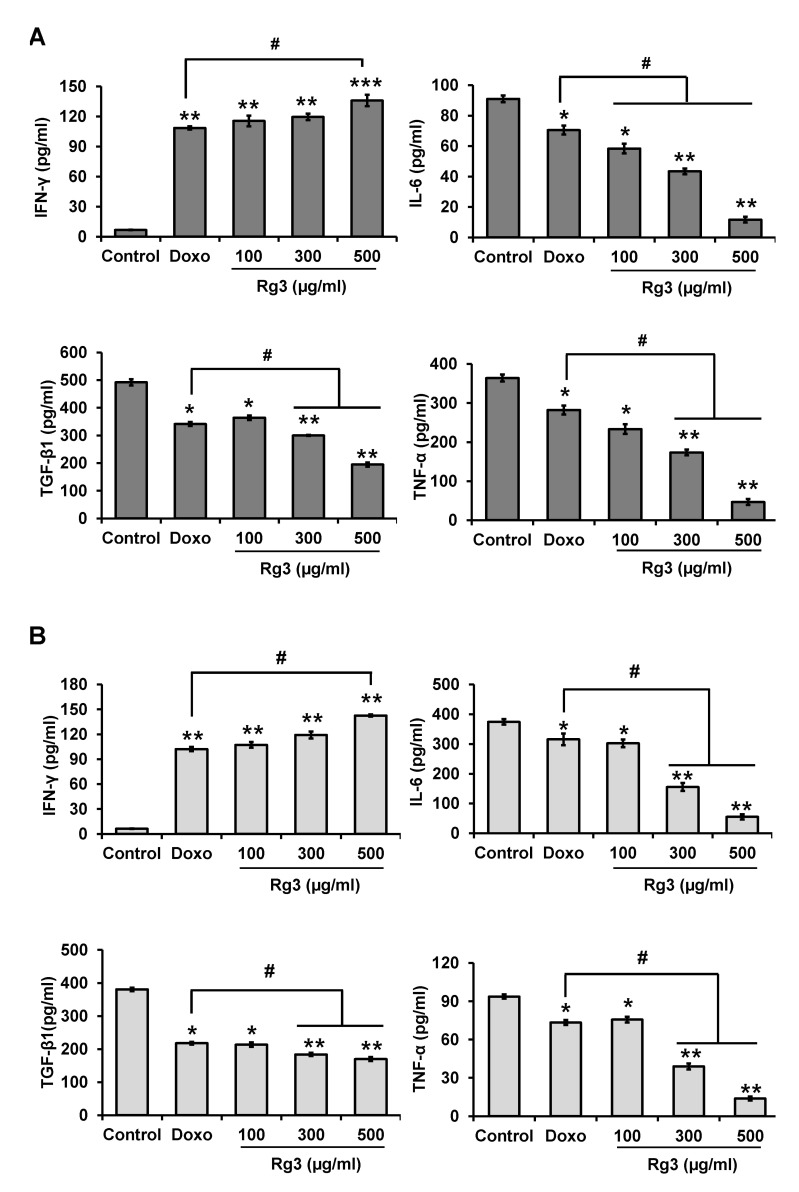
Figure 4. (A) The effect of ginsenoside Rg3 (100, 300, 500 µg/ml) on cytokine secretion from LLC cells. Each value is the mean±SE of three experiments. Each experiment was done in triplicate. Significant effects versus control are indicated with asterisks (*p<0.05, **p<0.01, ***p<0.001); #indicate the significant changes compared to Doxorubicin (0.01 µg/ml). (B) The effect of ginsenoside Rg3 (100, 300, 500 µg/ml) on cytokine secretion from B16F10 cells. Each value is the mean±SE of three experiments. Each experiment was done in triplicate. Significant effects versus control are indicated with asterisks (*p<0.05, **p<0.01, ***p<0.001); #indicates the significant changes compared to Doxorubicin (0.01 µg/ml).

Figure 4