. 2016 Feb 25;16(1):75–84. doi: 10.4110/in.2016.16.1.75

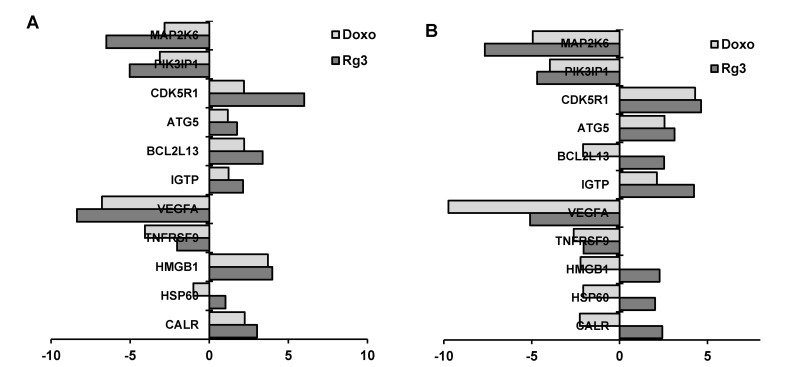
Figure 6. (A) Clustering of gene expression in LLC after treatment with Doxorubicin or Rg3. 11 genes were selected based on the fold change in expression (log2). Then, these genes were divided into control. The graph produced showed clusters using the Genplex software and the expression levels of genes are shown as graphs. (B) Clustering of gene expression in B16F10 after treatment with Doxorubicin or Rg3. 11 genes were selected based on the fold change in expression (log2). Then, these genes were divided into control. The graph produced showed clusters using the Genplex software and the expression levels of genes are shown as graphs.

Figure 6