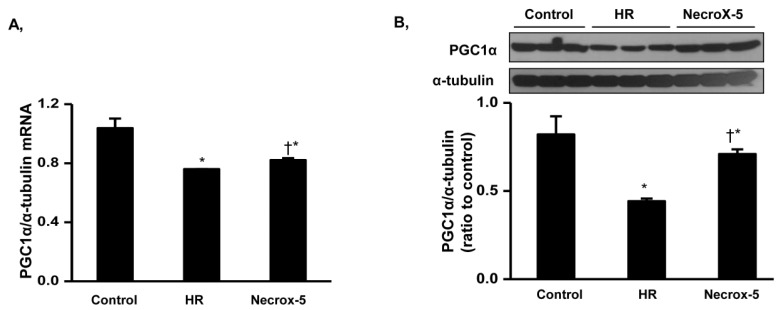
Fig. 3. PGC1α mRNA and protein expression levels in control, HR, and NecroX-5 treated hearts.
Real-time PCR and Western blot were performed to assess mRNA expression (A) and protein expression (B) of PGC1α normalized to α-tubulin in rat hearts. Cardiac tissue was selected from untreated HR hearts and HR hearts treated with 10 µM NecroX-5. n=3~6 for each group; *p<0.05 vs. control, †p<0.05 vs. HR.

