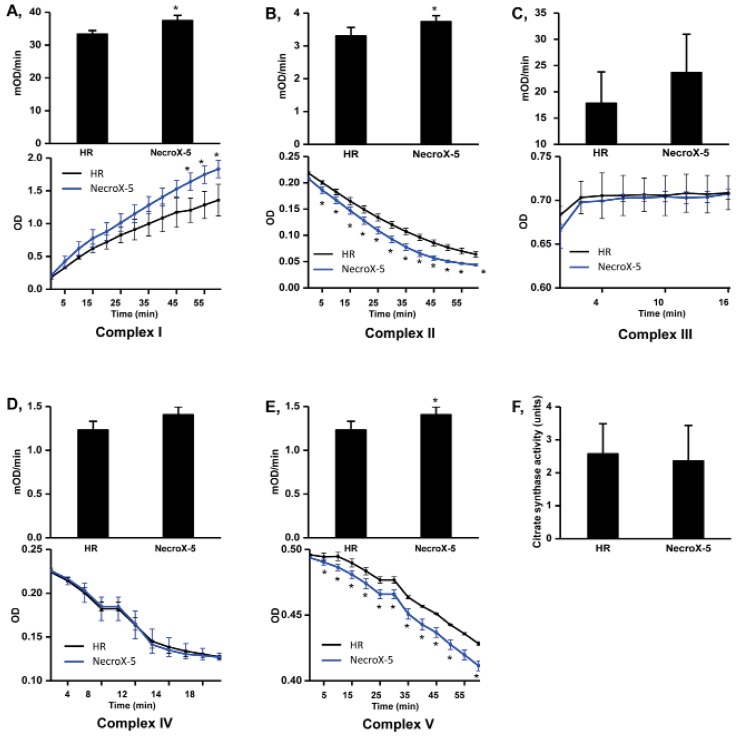
Fig. 4. Mitochondrial complex and citrate synthase activities in HR and NecroX-5 treated hearts.
Graphs illustrated the activity of mitochondrial complexes I~V (mOD/min) with the relative Vmax curves of complex I~V activity (OD) (A~E, upper panels) and mitochondrial citrate synthase activity (F) in untreated HR hearts and NecroX-5 treated HR hearts. n=4~5 for each groups; *p<0.05.

