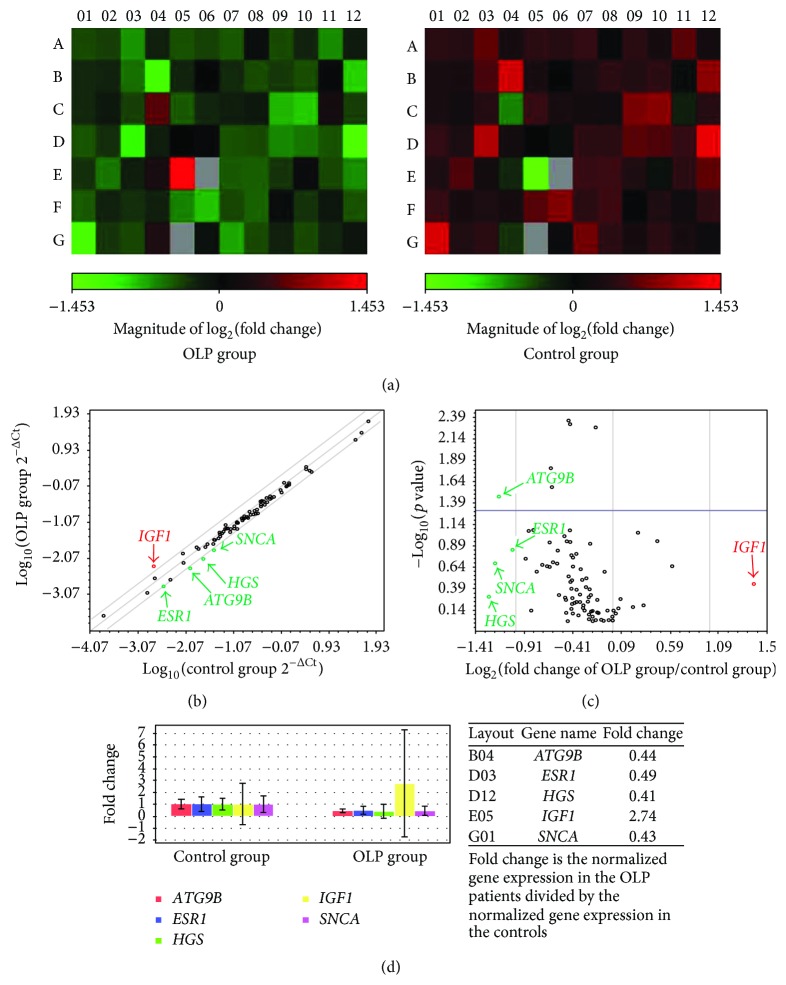
Figure 1.
Different expression of autophagy-associated genes in T cells of OLP. (a) Heat plot displayed different expression of autophagy-associated genes in peripheral blood T cells from OLP patients and controls. (b) Scatter plot showed expression of autophagy-associated genes, with a fold difference of 2. (c) Volcano plot showed the significant difference in expression of autophagy-associated genes on T cells between OLP patients and control individuals. Fold change and fold regulation bigger than 2 were highlighted in red; fold change less than 0.5 and fold regulation less than −2 were highlighted in green. (d) Multianalysis displayed obvious overexpressed IGF1 mRNA and decreased expression of ATG9B, HGS, ESR1, and SNCA in T cells of OLP.

