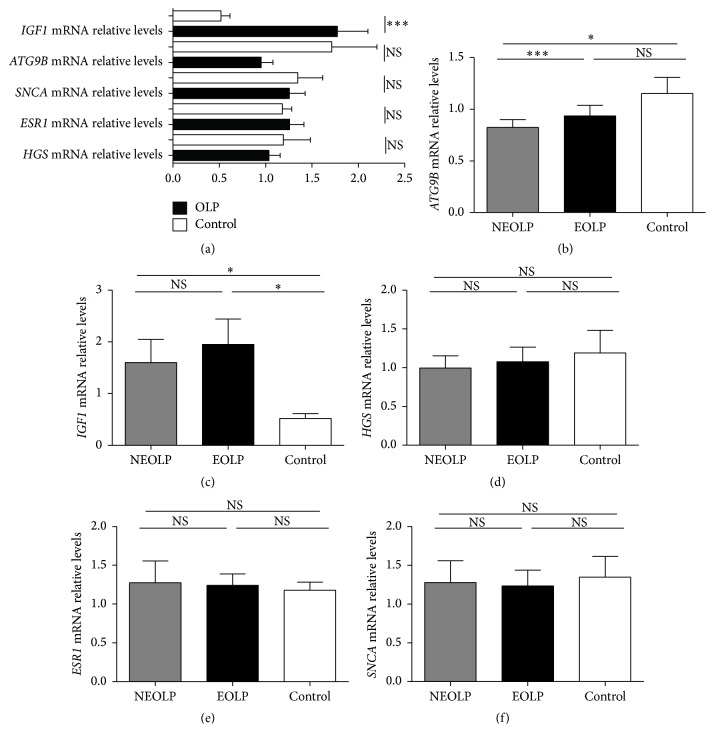
Figure 3.
Expression of IGF1, ATG9B, HGS, ESR1, and SNCA of T cells in OLP patients and controls. (a) Expression of IGF1, ATG9B, HGS, ESR1, and SNCA mRNA in T cells of OLP patients (n = 22) and controls (n = 10). (b–f) The mRNA expression of IGF1, ATG9B, HGS, ESR1, and SNCA in nonerosive OLP patients (NEOLP, n = 11), erosive OLP patients (EOLP, n = 11), and healthy controls (n = 10). Data were shown as mean ± SEM (∗∗∗ p ≤ 0.001, ∗ p < 0.05, NS: nonsignificantly).

