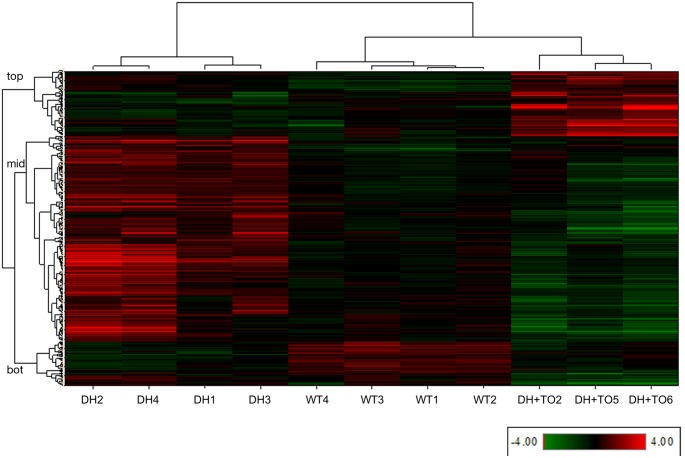
Fig. 1.
Heat map generated by unsupervised hierarchical clustering of individual sample level data (Log2-transformed RPKM expression values per gene) for the 641 unique genes found to be dysregulated in any group comparison, demonstrating that the different groups (DH, WT and TO) cluster together. Samples are clustered on the horizontal axis and genes on the vertical axis. Gene expression values are shown as red for high expression and green for low expression; intensity reflects the level. This reveals three large gene clusters, labeled as top, mid, bot. Information on gene names, fold changes (FC) and false-discovery rate (FDR) values for the group comparisons, and Gene Cluster and STEM profile number, are provided in Table S1. WT, control group.

