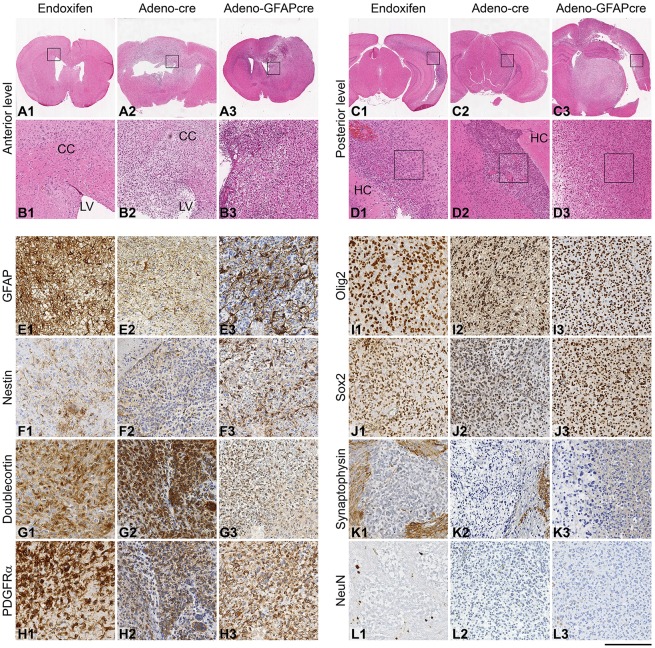
Fig. 5.
Formation of gliomas. The formation of gliomas was assessed in endoxifen-injected GLAST::CreERT2;p53loxP/loxP;PtenloxP/loxP mice (columns 1, 4), and in Adeno-Cre-injected (columns 2, 5) or Adeno-GFAP-Cre-injected p53loxP/loxP;PtenloxP/loxP mice (columns 3, 6). (A,C) Overview of coronal sections on the level of the SVZ. The boxes indicate the areas shown at higher magnification in B and D, showing a diffusely infiltrating glioma in the lateral corner of the ventricle. CC, corpus callosum; LV, lateral ventricle; HC, hippocampus. (C,D) Posterior level of the same brain as in A and B, showing an infiltrative tumour arising from the ventricle. The boxed areas in D indicate the areas shown in I-L. (E-L) Immunohistochemical analysis of the same brains, from the anterior level (A,B) or posterior level (C,D). Tumours elicited by the three methods show similar expression patterns, all consistent with gliomas. (E) Tumours express GFAP (note that underlying brain astrocytes also contribute to the GFAP-positive population). (F) Expression of nestin by tumour cell processes. (G-J) Strong expression of doublecortin (G), PDGFRα (H) and the markers Olig2 (I) and Sox2 (J). (K,L) None of the tumours express neuronal markers: synaptophysin (K) and NeuN (L) are negative in tumour cells, whereas they are expressed by surrounding brain tissue or in scattered entrapped neurones (L1). Scale bar: 4 mm (A,C), 500 µm (B,D) and 200 µm (E-L).

