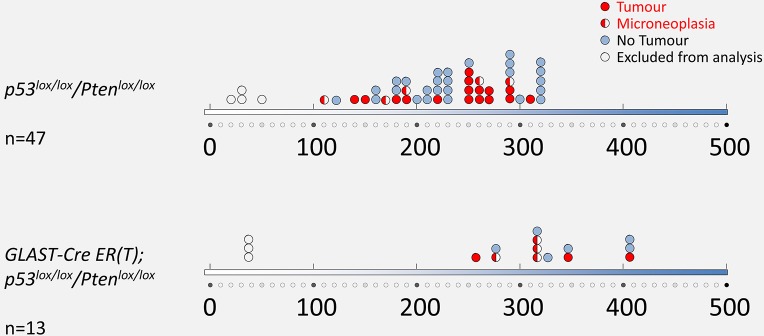
Fig. 7.
Latency and frequency of tumour formation after Cre-mediated recombination. The x-axis represents the latency in days and each circle represents an individual tumour. Half-filled circles represent precursor lesions. Mice that died prematurely or were culled owing to unrelated health concerns at 20-50 days of incubation were excluded from analysis, because tumour development does not occur before 100 days.

