Figure 1.

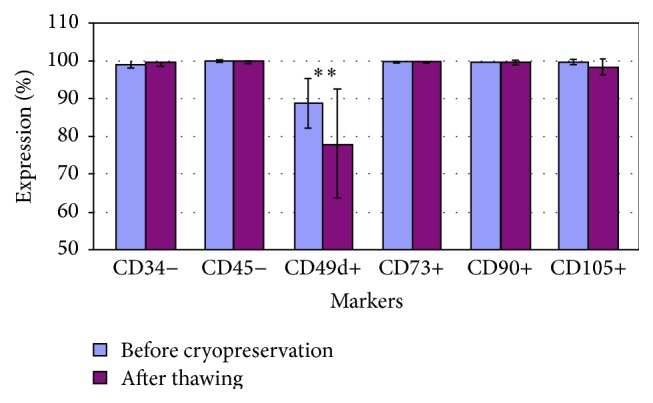
Surface markers expression of cells before cryopreservation and after thawing. The analysis was done by Cyflogic software 1.2.1. The t-test was done; p < 0.05 was considered significant. The results were p ∗∗ = 0,001.

Surface markers expression of cells before cryopreservation and after thawing. The analysis was done by Cyflogic software 1.2.1. The t-test was done; p < 0.05 was considered significant. The results were p ∗∗ = 0,001.