Figure 3.

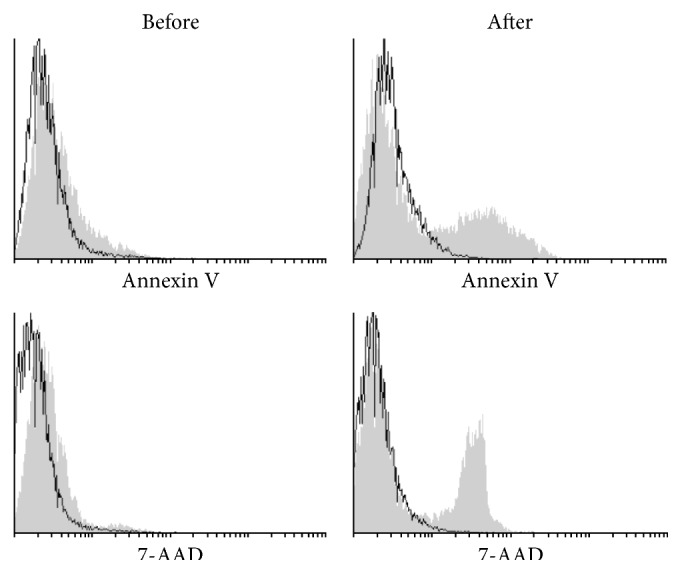
Histograms of Annexin V (apoptosis marker) and 7-AAD (viability marker) of the cells before and after cryopreservation. The grey color represents specific marker and the white color represents an isotype control.

Histograms of Annexin V (apoptosis marker) and 7-AAD (viability marker) of the cells before and after cryopreservation. The grey color represents specific marker and the white color represents an isotype control.