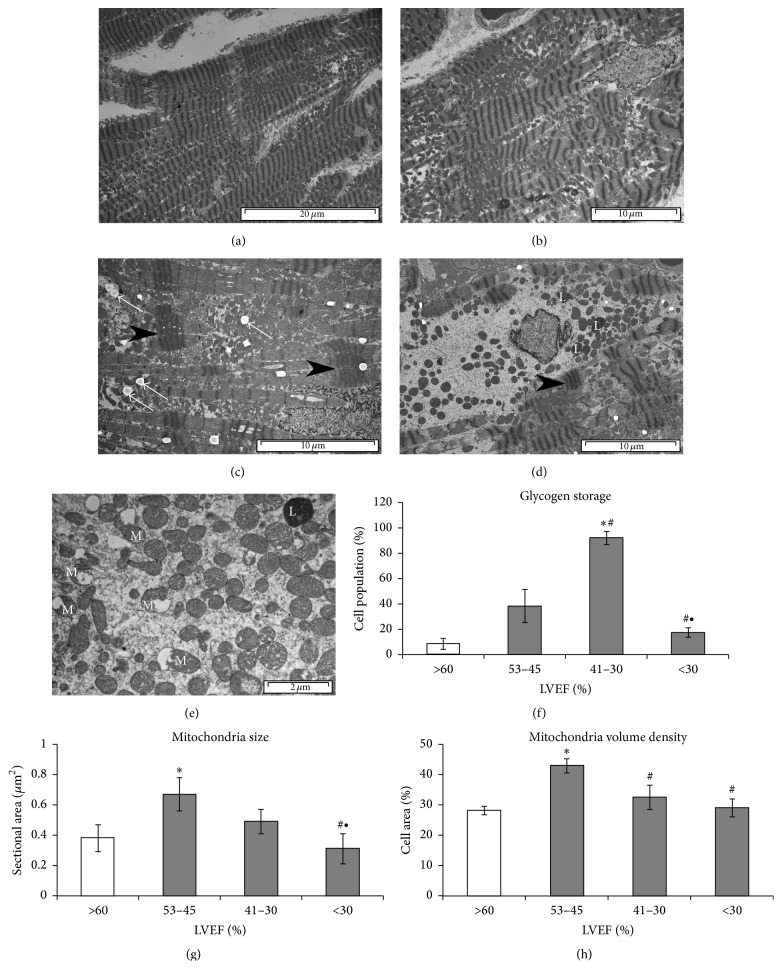
Figure 3.
Cardiomyocyte ultrastructural remodeling during heart failure progression. Representative images for (a) control heart. Cardiomyocytes with normal ultrastructure and oval mitochondria arranged in rows. (b) Heart Group (I) (LVEF 53–45%). Cardiomyocyte with increased number of various size mitochondria arranged in clusters, partially missing contractile apparatus, incidence of dilated T-tubule. (c) Heart Group (II) (LVEF 41–30%). Cardiomyocyte with missing contractile apparatus and contraction bands (black arrowheads), numerous polymorphic mitochondria, lipid droplets between mitochondria (white arrows), and (d) Heart Group (III) (LVEF < 30%). Cardiomyocyte with severe loss of contractile fibrils and contraction band (black arrowhead), scattered mitochondria, and lipofuscin granules (L). (e) Impaired mitochondria (M) in hearts with LVER < 30%; results of morphometric analyses. (f) Glycogen storage. (g) Mitochondria size. (h) Mitochondria volume density. Results as mean ± SEM; ∗ p < 0.05 versus control; # p < 0.05 versus Group (I); ∙ p < 0.05 versus Group (II).

