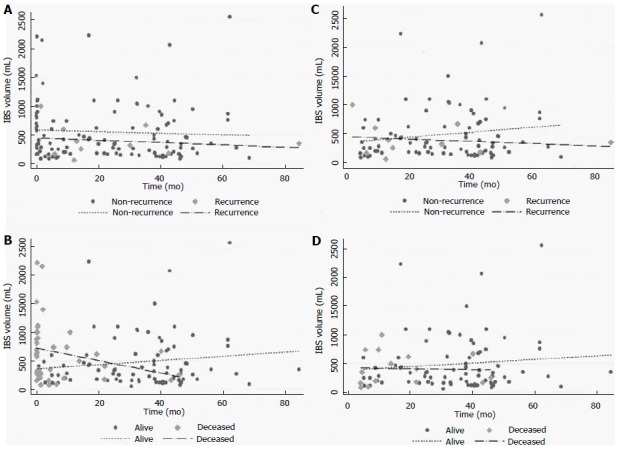
Figure 2.

Scatter plots of the infusion volume of autologous intraoperative blood salvage over time. Overall distribution (total, n = 122) according to the time for recurrence (A: Recurrence, 10/91) and death (B: Death, 41/92). Distribution at 90 d and longer according to the time for recurrence (C: Recurrence, 9/91) and death (D: Death, 15/92). IBS: Intraoperative blood salvage.
