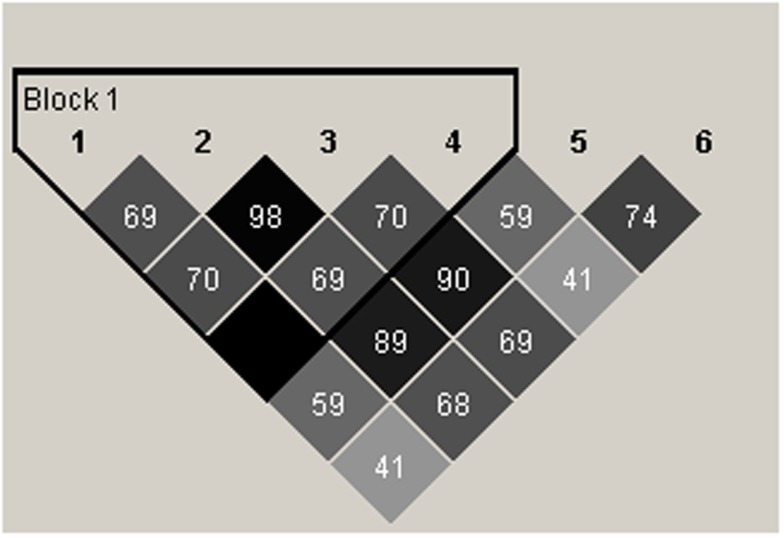
Figure 8.
Schematic representation of linkage disequilibrium (LD) between RGS4 SNPs in the SCZ, BPD, and NC groups. The LD block (thick black outline) consisting of four SNPs spans <1 kb (hence the Haploview program shows it as 0 kb). The number shown in each box in the figure corresponds to r2 which measures LD. r2 Values were calculated from the genotype data from the entire samples by Haploview. 1 = rs10917670 (SNP1), 2 = rs2661347, 3 = rs951436(SNP4), 4 = rs951439(SNP7), 5 = rs2661319(SNP18), 6 = rs10799897.

