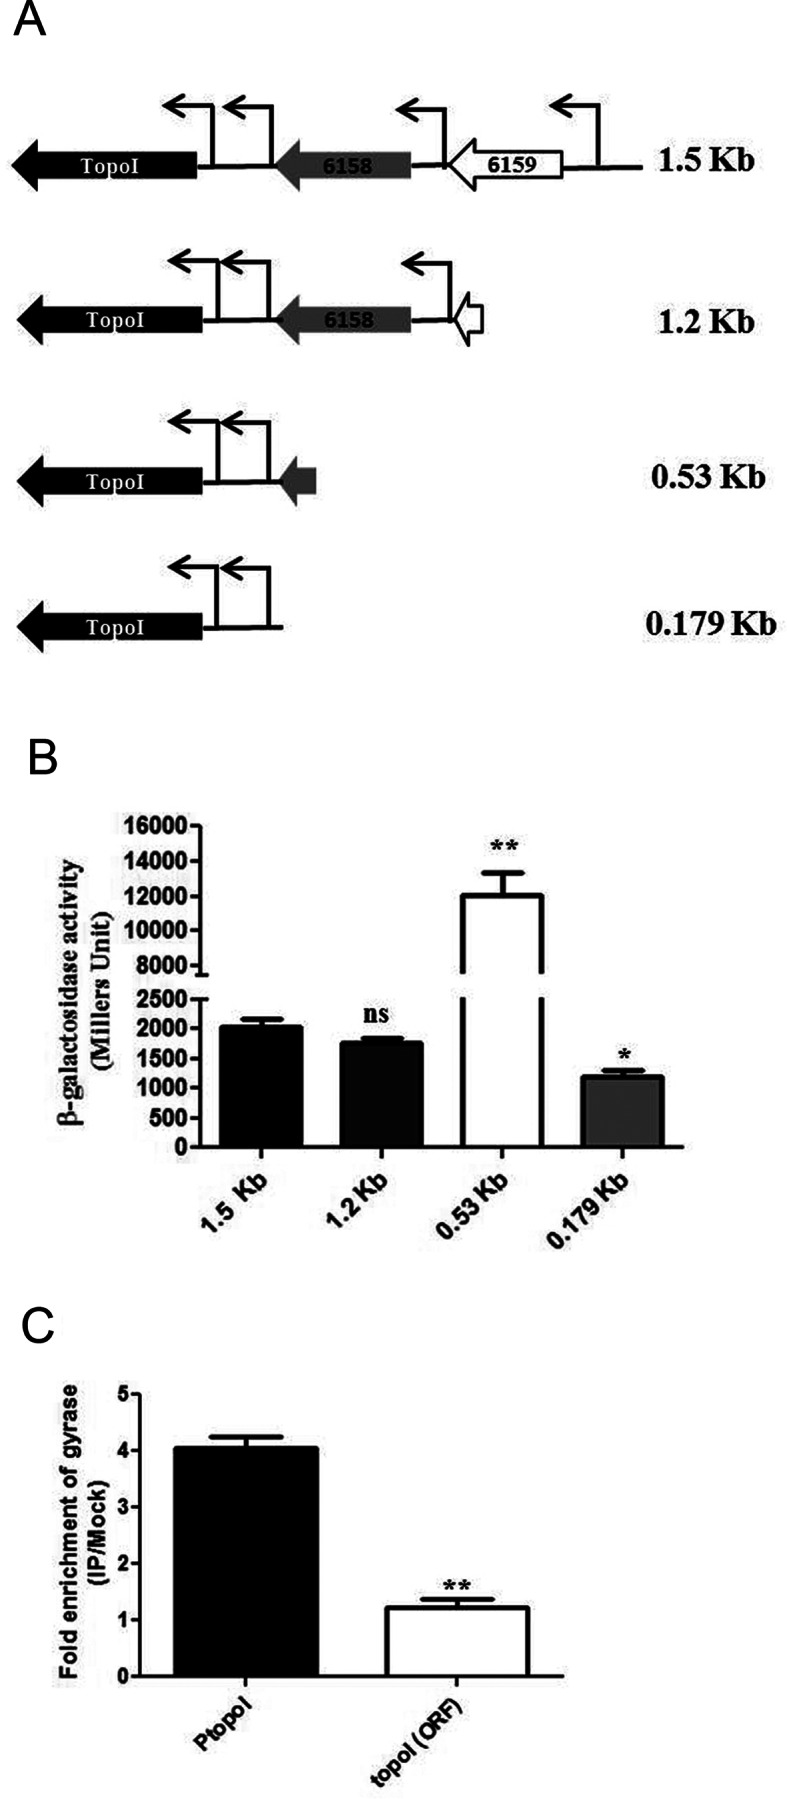
Figure 3.

Contribution of upstream elements on topoI promoter activity. (A) Schematic representation of the constructs generated for the study. (B) Measurement of the activity of various constructs harboring topoI promoter(s) by β-galactosidase assay. (C) Determination of gyrase binding on upstream region of topoI by ChIP-qRT PCR using the primers specific to the topoI upstream region. The enrichment values represent the enrichment of DNA fragment of interest (topoI promoter region and ORF) in immunoprecipitated (IP) sample over the mock. The error bars represent the SD obtained from three independent experiments.*P < 0.01, **P < 0.001, ***P < 0.0001, ns: not significant (P > 0.1).
