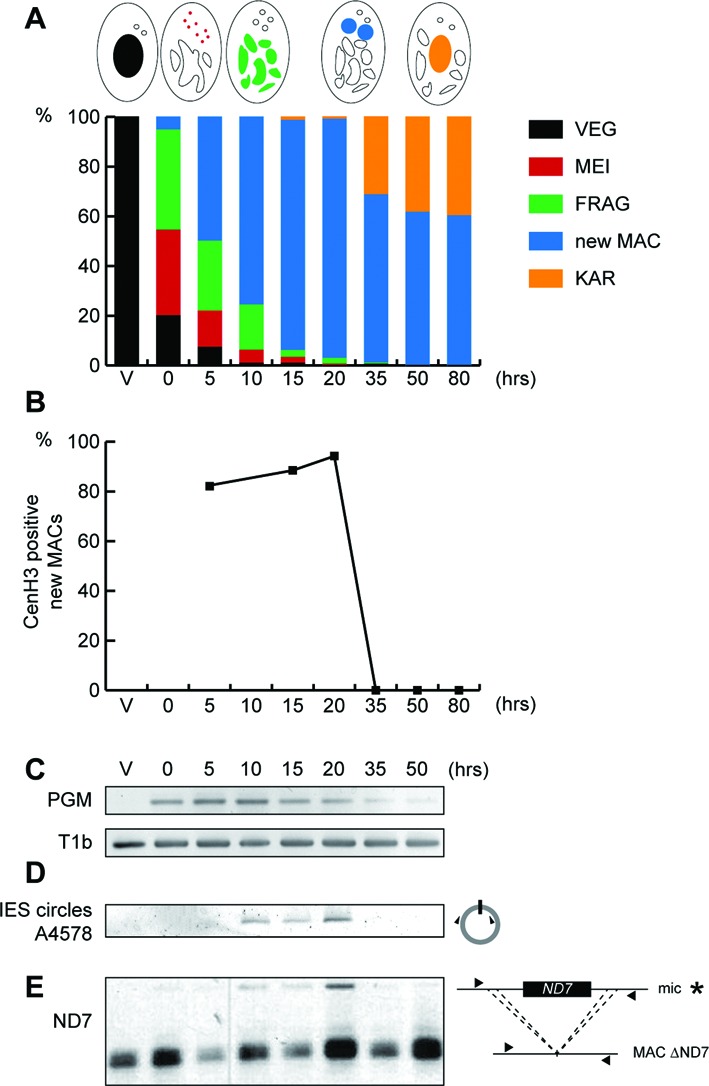
Figure 5.

Timing of CenH3 loss coincides with that of DNA elimination. (A) Progression of the self-fertilization process (autogamy) was followed by cytology with Hoechst staining during a time course experiment described in (19), in which a control gene (ICL7) has been silenced by RNAi. Schematic representations of key nuclear events are depicted above the histogram. The time-points refer to hours after T = 0 h that is defined as the time when approximately 50% of cells show fragmentation of the maternal MAC (FRAG). VEG: vegetative, MEI: meiosis, new MAC: two visible new developing MACs, KAR: karyonide (first cell division). (B) Quantification of CenH3a positive new developing MACs was scored for at least 100 cells, at each time point of the experiment described in (A), after immunolabeling with CenH3a antibody. (C) Detection of PGM mRNA by RT-PCR. Total RNAs were extracted at each time point of the experiment described in (A), and reverse transcribed. cDNAs were amplified by PCR with gene specific primers (Supplementary Table S2) and, as a loading control, with primers for the T1b gene, which encodes a component of the secretory granules. (D) PCR detection of IES 51A4578 circles with divergent primers (triangles, Supplementary Table S2) on genomic DNA at each time point of the experiment described in (A). (E) Somatic deletion of the ND7 gene. PCR analysis was performed on the same DNA samples as in (D) with primers (black arrows, Supplementary Table S2) located upstream and downstream of the ND7 open reading frame. The faint upper band (*) corresponds to the full length MIC version of the ND7 gene, which is transiently amplified before it is deleted from the new developing MACs. The more intense lower band corresponds to rearranged forms, originating from both the maternal and new MACs.
