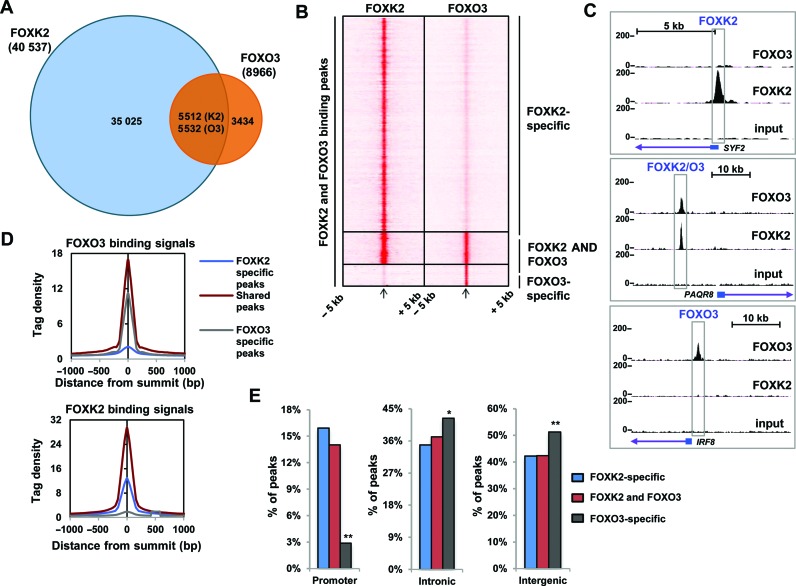
Figure 1.
ChIP-seq analysis of FOXK2 and FOXO3 binding profiles. (A) Venn diagram showing overlapping binding regions shared between FOXK2 and FOXO3. Numbers of peaks overlapping with respect to FOXK2 (K2) and FOXO3 (O3) are shown. (B) Heat map of tag densities of FOXK2 (left) or FOXO3 (right) ChIP-seq signal at all of the binding regions identified in the FOXK2 and FOXO3 ChIP-seq experiments. In each heat map the tag density is plotted for 5 kb either side of its binding peak summit. (C) UCSC genome browser views of FOXK2 and FOXO3 binding profiles associated with the indicated loci. (D) Average tag density profiles of FOXO3 (top) and FOXK2 (bottom) analyses mapped onto binding region summits of the indicated peak categories. (E) Genomic locations of the indicated groups of FOXK2 and FOXO3 binding regions. * = P < 0.05; **P < 0.01.

