Figure 3.
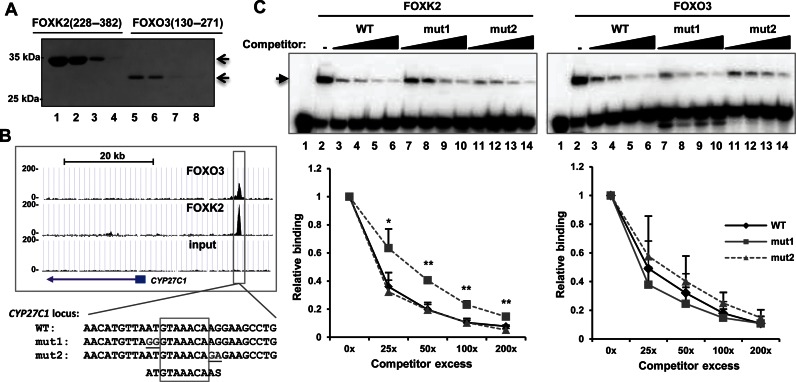
The 5′ flanking region is important for FOXK2 binding to DNA. (A) Coomassie staining of SDS–PAGE analysis of 5% of each four separate eluted samples of purified His-tagged FOXK2(228–382) and FOXO3(130–271) (containing the forkhead DNA-binding domain). (B) UCSC browser view of the FOXO3 and FOXK2 ChIP-seq peaks of CYP27C1 locus. DNA sequences of the wild-type and mutant binding regions used in EMSA experiments are shown below. Mutated bases are underlined and the core GTAAACA motif boxed. (C) Competition EMSA experiment using increasing concentrations (25x, 50x, 100x and 200x molar excess) of the indicated unlabeled sequences to compete for binding of FOXK2 (left) or FOXO3 (right) proteins to the labelled wild-type (WT) sequence. Protein–DNA complexes are indicated by the arrow. Quantification of the FOX–DNA binding at each concentration of competitor relative to binding in the absence of competitor (taken as 1) is shown below. The error bars represent the standard deviations of three independent experiments. * and ** represent P < 0.05 and P < 0.01, respectively.

