Figure 2.

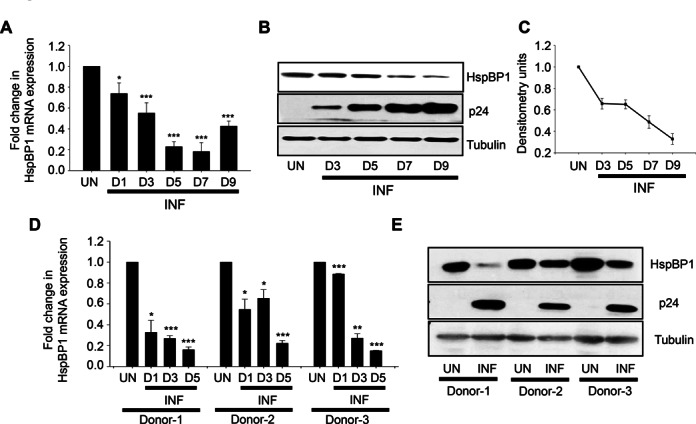
HspBP1 is down modulated during HIV-1 infection in both T cells and PBMCs. (A) mRNA expression profiling of HspBP1 during HIV-1 infection. Jurkat cells were infected with 0.1 MOI HIV-1NL4-3 and were harvested on day 1 (D1), day 3 (D3), day 5 (D5), day 7 (D7) and day 9 (D9), post infection for quantitative real time PCR analysis. (B) Representative western blot showing expression profile of HspBP1 in HIV-1NL4-3 infected Jurkat cells at different time points. (C) Densitometry analysis of HspBP1 expression in western blot shown in (B). (D) qRT-PCR analysis of HspBP1 mRNA expression in HIV-1NL4-3 (0.1MOI) infected PBMCs on day 1 (D1), day 3 (D3) and day 5 (D5) post infection. (E) HspBP1 protein expression analysis in HIV-1NL4-3 infected PBMCs on day 5 (D5) post-infection using immunoblotting. PBMCs were isolated from blood of three healthy donors obtained from local blood bank and were infected with HIV-1NL4-3. The expression of viral capsid protein p24 was measured to monitor the progression of infection. The results shown in (A) and (D) are represented as fold change in expression as compared to uninfected cells (UN). The results shown in (A) and (C) are representative of three independent experiments. (D) represents data from two experiments. The error bars are presented as the mean ± SD values and significance is defined as *P ≤ 0.05, **P ≤ 0.01 and ***P ≤ 0.001.
