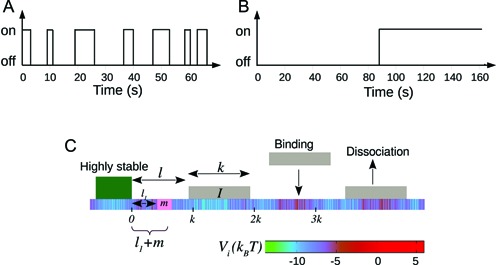
Figure 1.

(A and B) Figure comparing two different nucleosome kinetic histories: switching from nucleosome ‘off’ (exposed) to ‘on’ (covered) state happens with a mean time 1/k+, and ‘on’ to ‘off’ state happens with mean time 1/k−. The rates are chosen such that (i) k+ = k− = 0.1s−1 and (ii) k+ = k− = 0.01s−1. Due to equality of binding and unbinding rates, both (A and B) lead to average occupancy of 50%. Yet the protein binding kinetic histories may be quite different for (A) as compared to (B)—see section 1 of Supplementary Material for details. (C) A schematic figure of the kinetic model studied in this paper is shown. Effective histone-DNA binding potential Vi (see Equation 1) is represented by color gradient, whose magnitudes (in kBT) are shown in the horizontal bar. Dark green block depicts a highly stable barrier while light gray blocks represent nucleosomes of size k = 147. The target patch of size m at distance l1 from the barrier is marked pink on the DNA lattice.
