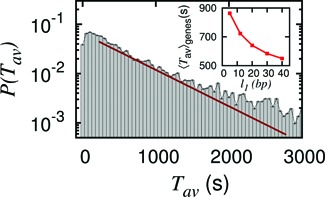
Figure 7.

Genome-wide probability distribution of average exposure time,  , of a patch downstream of the TSS shows huge diversity. Parameters are: m = 10 bp, l1 = 5 bp, number of genes = 5160. The distribution deviates from simple exponential (red line—showing guide to eye), reflecting the heterogeneity in genomic sequence. Inset: 〈Tav〉genes versus l1 showing typical behavior as seen in the case without sequence (Figure 3C red curve).
