Figure 5.
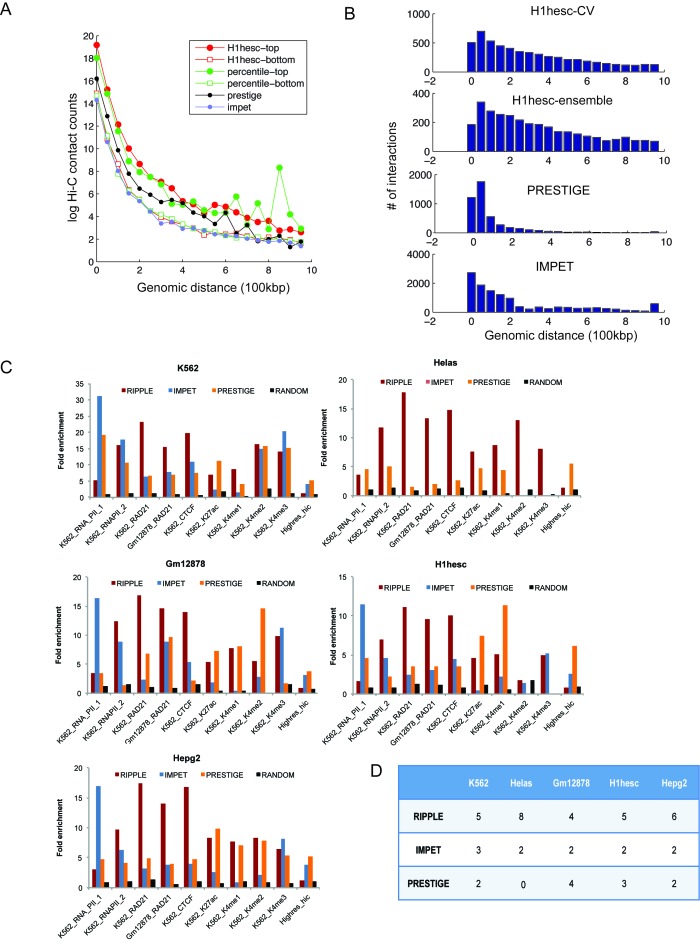
Evaluation of genome-wide enhancer-promoter interaction maps. (A) Shown is the distribution of normalized Hi-C contact count frequencies in genome-wide predictions for the H1hesc cell line. H1hesc-top: the interactions in the 90% confidence of the classifier trained using only H1hesc 5C data, H1hesc-bottom: interactions predicted at 10% confidence by the classifier trained only on the H1hesc data, percentile-top and percentile-bottom: Same as in H1hesc-top and bottom but using predictions from the percentile ensemble. PRESTIGE: interactions obtained from the PRESTIGE method, IMPET: interactions obtained from the IM-PET method. (B) Distribution of the number of interactions as a function of genomic distance using H1hesc-only classifier (RIPPLE H1hesc CV), Ensemble (RIPPLE H1hesc Ensemble), PRESTIGE and IMPET. (C) Fold enrichment of predicted interactions from RIPPLE, IMPET and PRESTIGE in experimental data sets of long-range interactions generated using ChIA-PET or high-resolution Hi-C. Each barplot shows a fold-enrichment measure of the number of recovered interactions of a particular type in the high confidence set of interactions. The RNA_PolII_1 data set is from Li et al., whereas the RNA_POLII_2 data set is from Heidari et al. All data sets other than Hires_Hi-C are ChIA-PET data sets. (D) Shown is the number of data sets for different cell lines (column) in which a method (row) was the best (highest fold enrichment) among the three methods compared. The greater the number the more often was a method ranked the best.

