Figure 1.
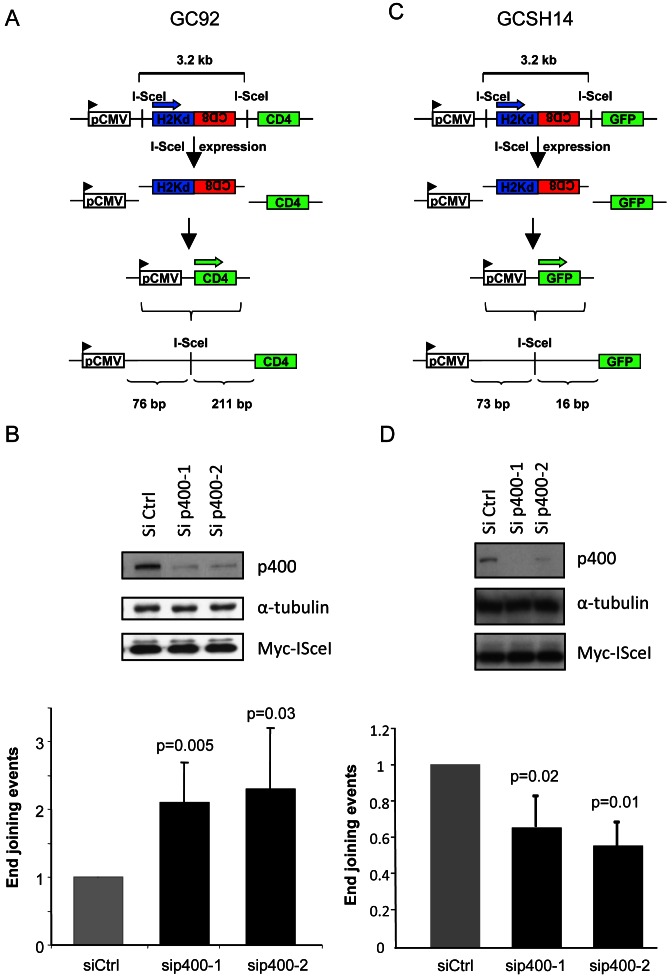
Effects of p400 depletion on NHEJ events. (A) Schematic representation of the NHEJ substrate present in GC92 cell line. (B) Frequency of NHEJ events in GC92 cells. For sip400-1, n = 5, for sip400-2, n = 4. Results are presented as the mean ± SD of independent experiments. (C) Schematic representation of the NHEJ substrate present in GCSH14 cell line. (D) Frequency of NHEJ events in GCSH14 cells. Results are the mean ± SD of five independent experiments.

