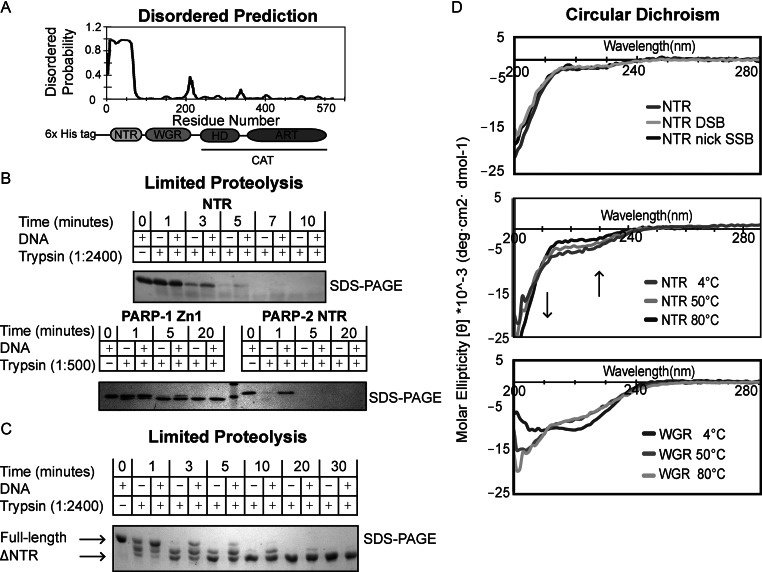
Figure 2.
The N-terminal region (NTR) of PARP-2 is natively disordered. (A) Predicted disordered regions of human PARP-2 as determined by the bioinformatics tool DISOPRED. The NTR of PARP-2 has a high probability of being disordered. (B) Time course of human PARP-2 limited proteolysis resolved on 18% SDS-PAGE. Top: SDS-PAGE analysis of 1:2400 trypsin digest of PARP-2 NTR (2 μg) in the presence and absence of DSB (2 μM) for the indicated time points. Bottom: SDS-PAGE analysis of 1:500 trypsin digest of PARP-1 Zn1 and PARP-2 NTR (2 μg) in the presence and absence of DSB (2 μM). (C) Time course of human full-length (FL) PARP-2 limited trypsin proteolysis (1:2400) resolved on 7.5% SDS-PAGE in the presence and absence of DSB (2 μM). FL PARP-2 limited proteolysis analysis on SDS-PAGE showing a truncated, proteolytic resistant PARP-2 after 5 min (D) Top: CD analysis of PARP-2 NTR data collected at 4°C using 10 μM protein in the absence or presence of activating DNA (DSB and nick SSB) (10 μM). Middle: PARP-2 NTR displays identical CD signal at 4, 50 and 80°C. Arrows indicate regions of temperature-dependent changes in CD signal expected for intrinsically disordered proteins. Bottom: temperature-dependent CD analysis of PARP-2 WGR (10 μM) showing that WGR undergoes a structural transition from 4 to 50 to 80°C. All scans were performed in triplicates and averaged to generate the curve shown. The curves are representative of three independent experiments.

