Figure 3.
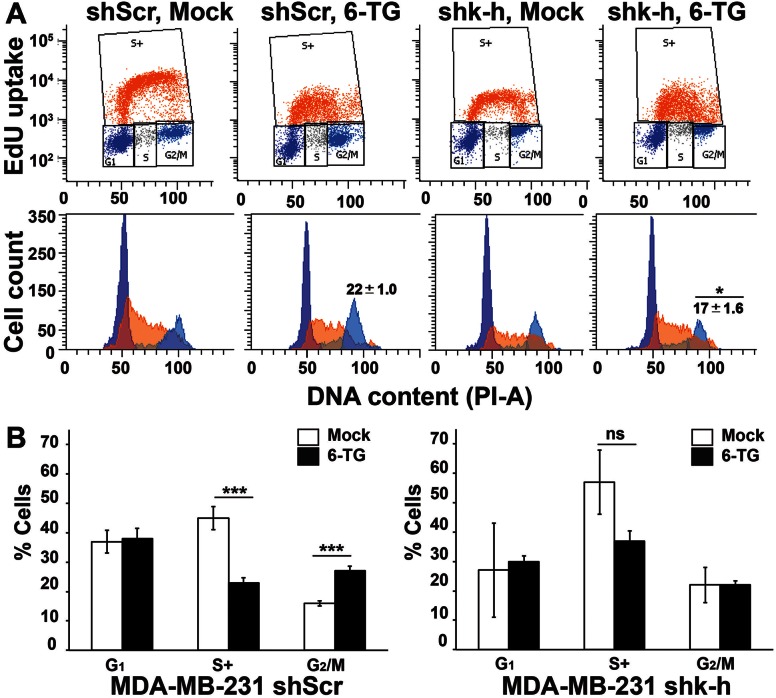
K-H depletion results in defective G2 cell cycle checkpoint arrest responses, similar to MMR-deficient cells in response to 6-TG exposure. Stable shScr or shk-h 231 cells were exposed to 0.5 μM 6-TG for 24, 48 or 72 h and analyzed by flow cytometry for changes in cell cycle distributions. (A) Cell populations were gated for G1 (dark blue), S-phase (active EdU incorporation, S+ (orange)) and G2/M (light blue) phases of the cell cycle (represented in top panel) based on PI staining and EdU incorporation. Flow diagrams with cell counts are represented with similar color scheme in the bottom panel. Numbers shown on top of G2 peak represent mean, ±SD from at-least three experiments and asterisk (*) indicates P ≤ 0.05 calculated for shScr versus shk-h. Representative images shown in panel A are for 48 h time point where substantial changes in G2 population of mock versus 6-TG treated shScr cells started to appear. (B) Quantification of cell cycle phase distributions of shScr (left) or shk-h (right) 231 cells after mock (open bars) or 6-TG exposure (closed bars) for 72 h are shown (where most significant changes occurred in mock versus 6-TG treated shScr G2 population) for cells treated as in ‘A’. Shown are means, ±SD from experiments performed at-least three times and P-values determined using two-tailed Student's t-tests. Complete time-course data quantifications are presented in Supplementary Figure S3. ***P ≤ 0.001.

