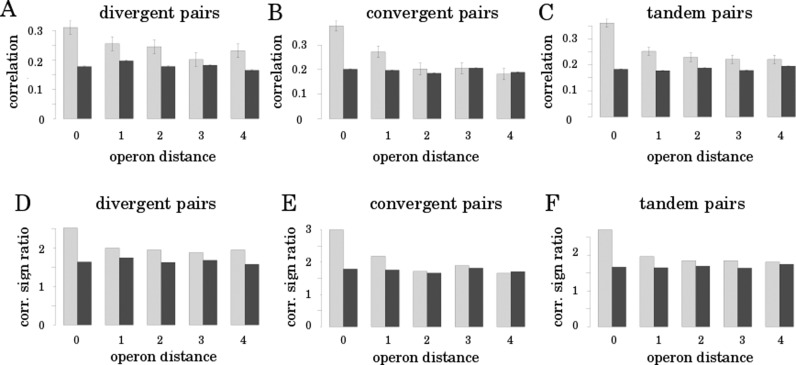
Figure 1.
Spatially resolved correlation of temporal gene expression. The light-gray bars represent the mean Pearson correlation of the temporal expression of all operon pairs with a respective orientation. The black control bar indicates the mean correlation of randomly reassigned gene pairs from the same pool. The abscissa indicates the number of operons between the pair of investigated operons from 0 for a direct neighborhood up to 4. For the correlation of operon expression, the expression patterns of the closest genes of the pairs were chosen. Panels (A–C) depict the pairs with divergent, convergent and tandem orientation of operons respectively. Panels (D–F) depict the ratio of the numbers of positive and negative correlations incorporated in the mean correlation values of A–C. For the correlation values error bars are indicated (SEM).

