Figure 7.
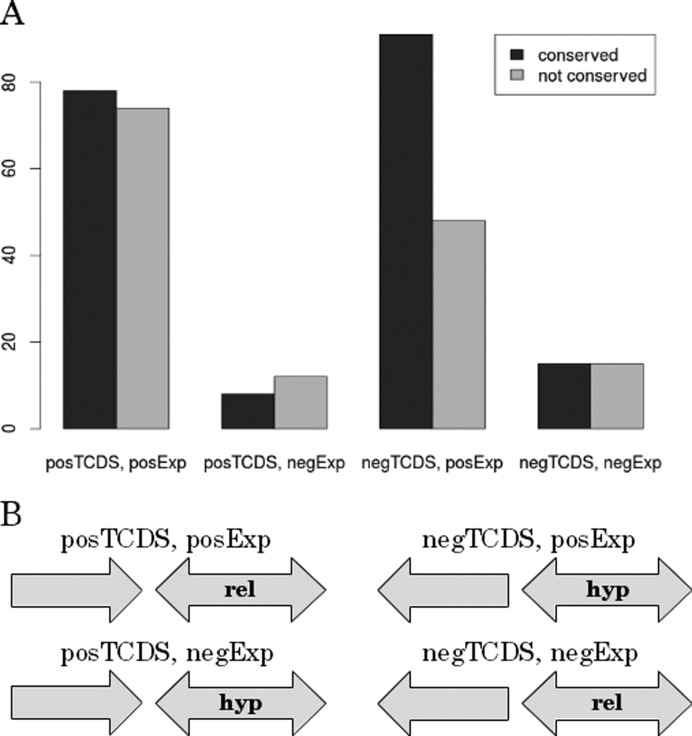
Comparative genomics analysis of orthologs within the clade of Enterbacteriaceae. (A) Depicted is the conservation of effects of the neighboring genes with strongest positive and negative TCDS on the target gene. These two groups are further subdivided into the subset that contributes positively and negatively to target gene expression. We separately investigated four different groups: posTCDS, posExp = neighbor with strongest positive TCDS contribution on the target gene TCDS level and positive impact on gene expression of the target. posTCDS, negExp = neighbor with strongest positive TCDS contribution on the target gene TCDS level and negative impact on gene expression of the target. negTCDS, posExp = neighbor with strongest negative TCDS contribution on the target gene TCDS level and positive impact on gene expression of the target. negTCDS, negExp = neighbor with strongest negative TCDS contribution on the target gene TCDS level and negative impact on gene expression of the target. The abscissa depicts the total counts of conserved TCDS impact on the target gene. (B) Scheme of gene arrangement in the four separate groups. Hyp and rel indicate a preference for high negative and low negative supercoiling respectively inferred from the temporal correlation or anti-correlation of target gene TCDS and gene expression.

