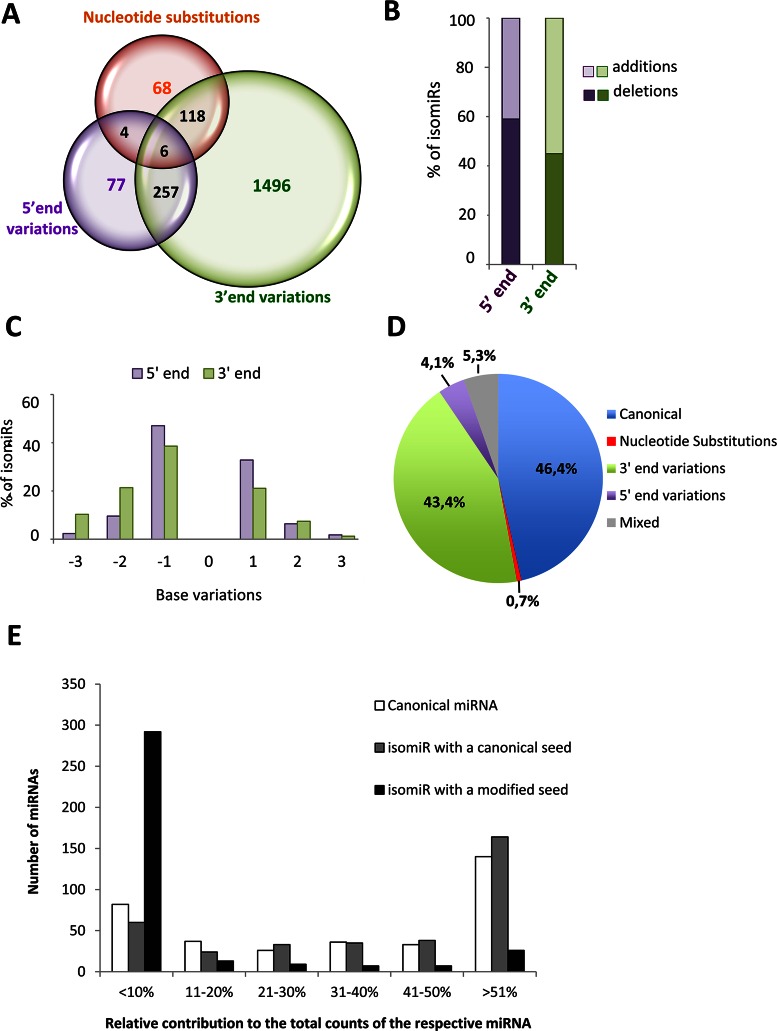
Figure 2.
Summary of isomiR heterogeneity and relative contribution of isomiRs with modified or canonical seed to miRNA expression in the human retina. (A) Venn diagram illustrating the number of retinal miRNA variants, classified in three types of sequence variation (5′-end variations, 3′-end variations, nucleotide substitutions). (B) Bar-graph indicating the percentage of 5′ or 3′ modifications that correspond to nucleotide additions (light colour) or trimming events (dark colour). (C) Percentage of individual isomiRs with templated additions or trimming of up to 3 nucleotides at the 5′ or 3′-end compared to the corresponding canonical sequences. (D) Pie-chart illustrating the average contribution of the different categories of isomiRs to miRNA expression in the human retina. (E) Contribution of canonical miRNAs (white bars) and of isomiRs with a canonical (grey bars) or modified seed (black bars) to overall miRNA expression in the human retina. The bars report the number of miRNAs for which the expression of each sequence class, relative to total counts, is within the five categories indicated on the x-axis. The data reported in this figure refer to the analysis of isomiRs detected in all retina samples (n = 16).

