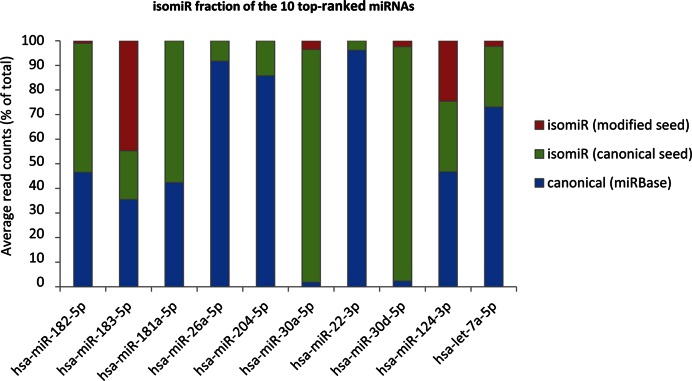
Figure 3.
IsomiR contribution to the expression of the most abundant miRNAs in the human retina. Bar plots showing the relative contribution to expression (shown as percentage of total read counts) for the ten most abundant miRNAs in the human retina. Blue area: canonical sequence (same sequence as the reference miRNA annotated in the miRBase); Green area: isomiRs bearing the same seed as the canonical miRNA; Red area: isomiRs with a modified seed sequence. The analysis was performed on isomiRs detected in all retina samples (n = 16).

