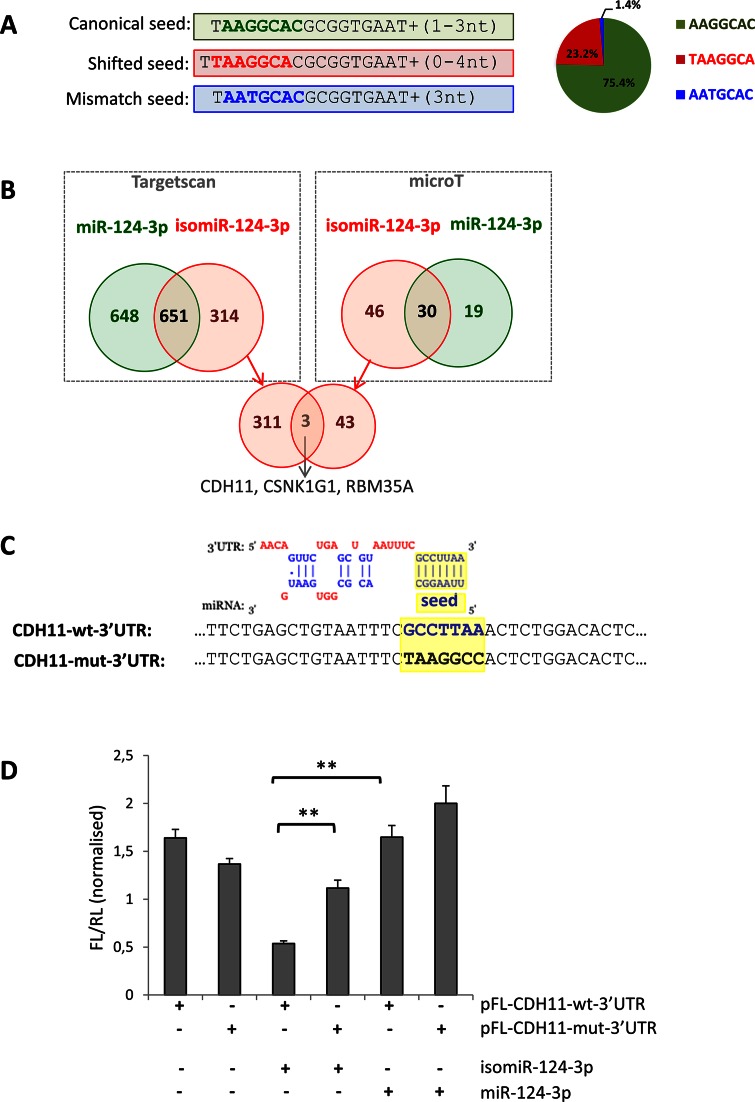
Figure 4.
Analysis of different targeting capabilities of the 5′ isomiR-124-3p. (A) The reads mapping to miR-124-3p present three different seed sequences; the canonical seed (bold green), a modified seed due to seed-shifting (bold red) and a seed bearing a base-substitution (bold blue). The pie-chart on the right shows their relative abundance. Detailed sequence information and average frequency is shown in Supplementary Table S7. (B) Venn diagrams showing the overlap of the predicted targets for the miR-124-3p (green) and the most abundant isomiR with a shifted seed (red). Predictions were performed using the microT (right box) and TargetScan (left box) software. The intersection of the Venn diagram (bottom of the panel) shows the three genes predicted in common by both software to be targeted only by the isomiR. (C) Top: alignment of the predicted binding of the seed-shifted isomiR-124-3p and the 3′ UTR of the CDH11 mRNA (as in microT output). Bottom: sequence alignment of the corresponding region in the vectors bearing the wild-type (CDH11-wt-3′UTR; bold blue) and mutated (CDH11-mut-3′UTR; bold black) predicted seed-binding site (highlighted in yellow). (D) Relative luciferase activity of pFL-CDH11-wt-3′UTR and pFL-CDH11-mut-3′UTR in HeLa cells co-transfected with mimics for miR-124–3p and the seed-shifted isomiR (isomiR-124-3p). Firefly luciferase values are normalized against the Renilla luciferase. Error bars are ±SEM of three independent experiments (performed in triplicate). **: P < 0.005.

