Figure 8.
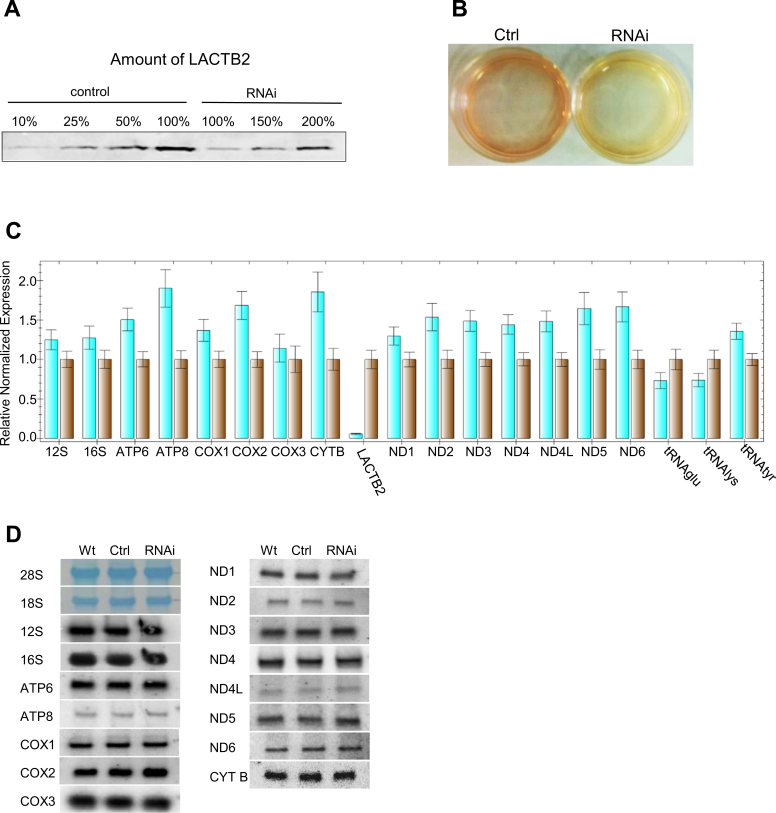
Downregulation of LACTB2 expression resulted in modest accumulation of mitochondrial transcripts. (A) Quantitation of the amount of LACTB2 in the siRNA treated cells. siRNA duplex targeted for LACTB2 or scrambled siRNAs duplexes, as a negative control, were transfected into HEK-293 cells. Cells were collected 48 h post-transfection and the amount of LACTB2 was determined using immunoblotting assay. Proteins from equal number of cells were loaded in the lanes labeled 100%. Proteins from 50, 25 and 10% of the control and 150 and 200% of the siRNA LACTB2 treated cells were analyzed for the amount of LACTB2, in order to determine the degree of down-expression. (B) Medium acidification due to treatment with siRNA duplex, 48 h post-transfection. Ctrl—cells treated with scrambled siRNAs duplexes as a negative control. RNAi—cells treated with siRNA duplex targeted to LACTB2. (C) The amount of mitochondrial transcripts in the cells treated with the siRNA duplex targeted to LACTB2 (turquoise bars), or with scrambled siRNAs duplexes as a negative control (brown bars), was analyzed by qRT-PCR. The GAPDH transcript was used as the reference gene for normalization of the expression. The error bars display the standard errors of at least three independent experiments. (D) Northern blot analysis of HEK-293 cells that were not transfected (WT), transfected with scrambled siRNAs as control (Ctrl) or transfected with LACTB2 siRNA (RNAi). Hybridizations were performed with probes specific to the mitochondrial mRNAs, rRNAs and, stained cytosolic 28S and 18S rRNAs as loading control.

