
Figure.
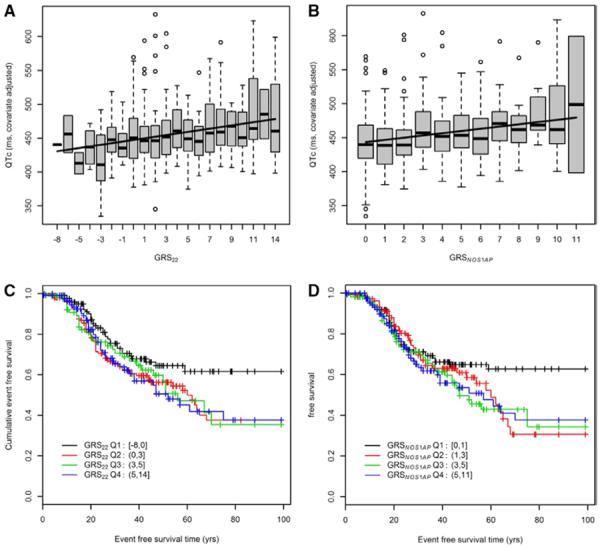
A and B, Association between the genetic risk scores, GRS22 and GRSNOS1AP, and the QTc-interval in LQT2 patient Set 1 and Set 2 combined (n=639; GRS22: P=4.3×10⁻⁶; GRSNOS1AP: P=4.2×10⁻⁷). C and D, Analysis of the relation between the genetic risk scores, GRS22 and GRSNOS1AP, and event-free survival in LQT2 patient Set 1 and Set 2 combined (n=639; GRS22: P=0.192, GRSNOS1AP: P=0.119). Q1 is the quartile with the lowest genetic risk score.